VOLUNTEERING PROJECTS
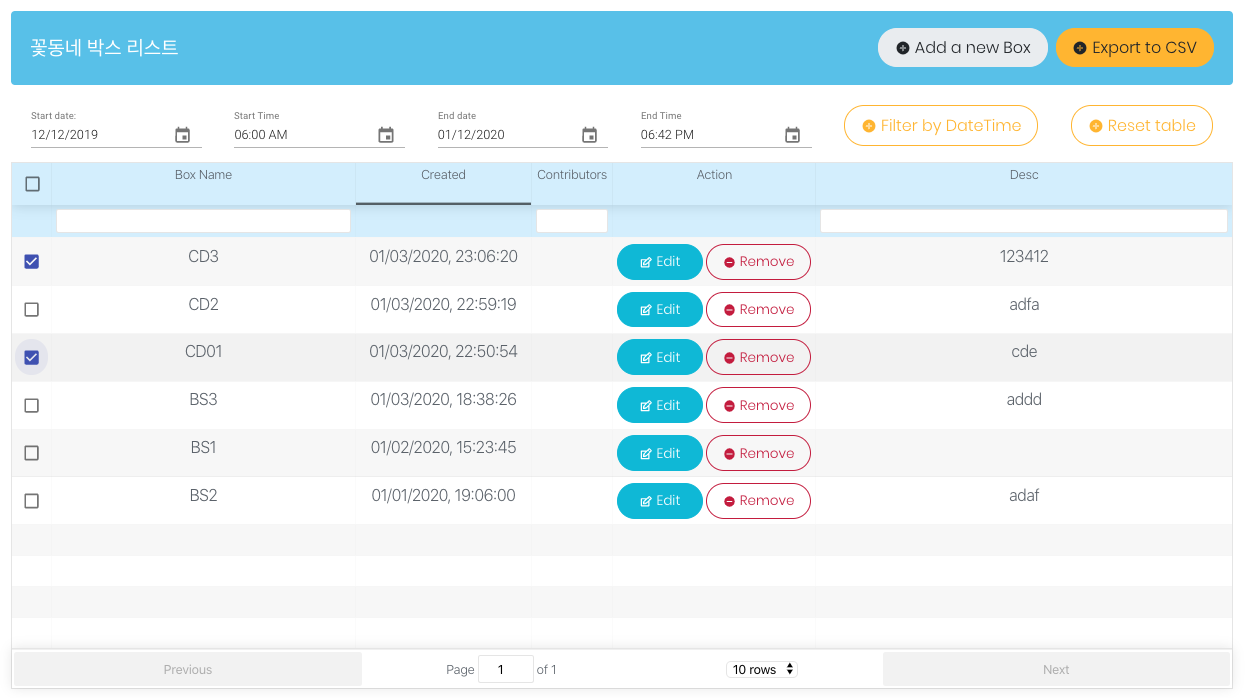
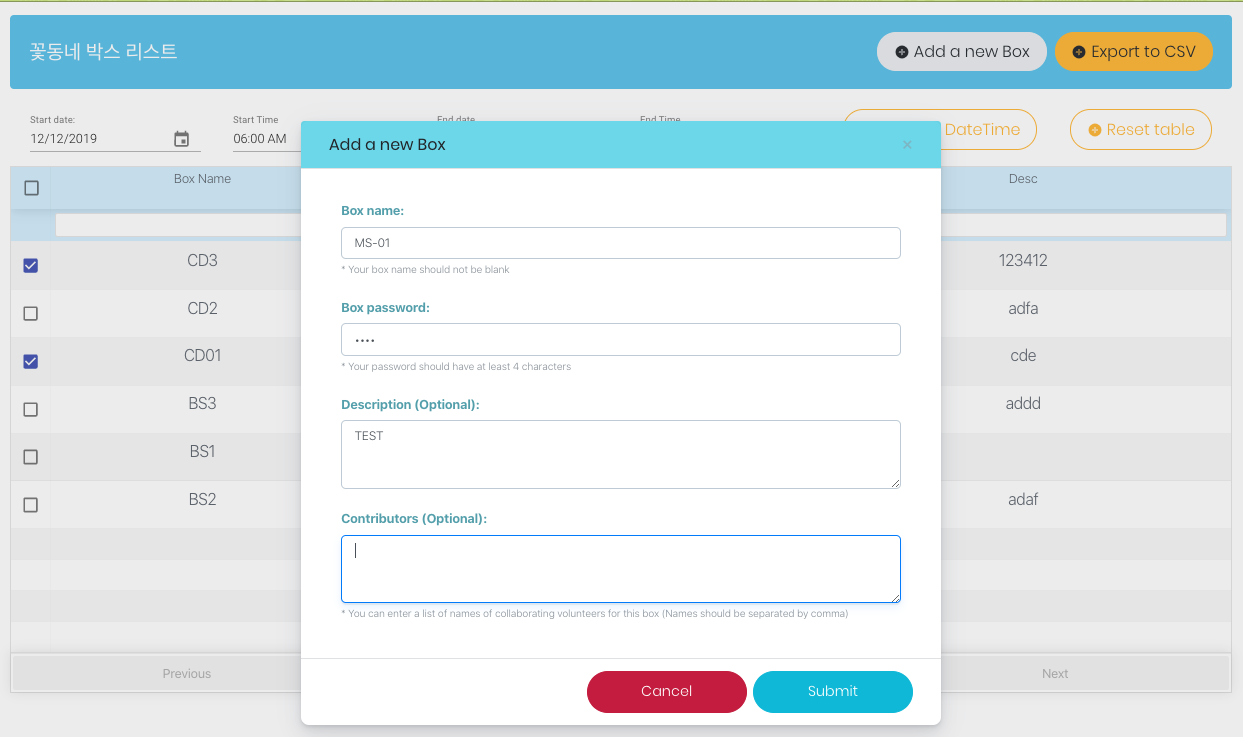
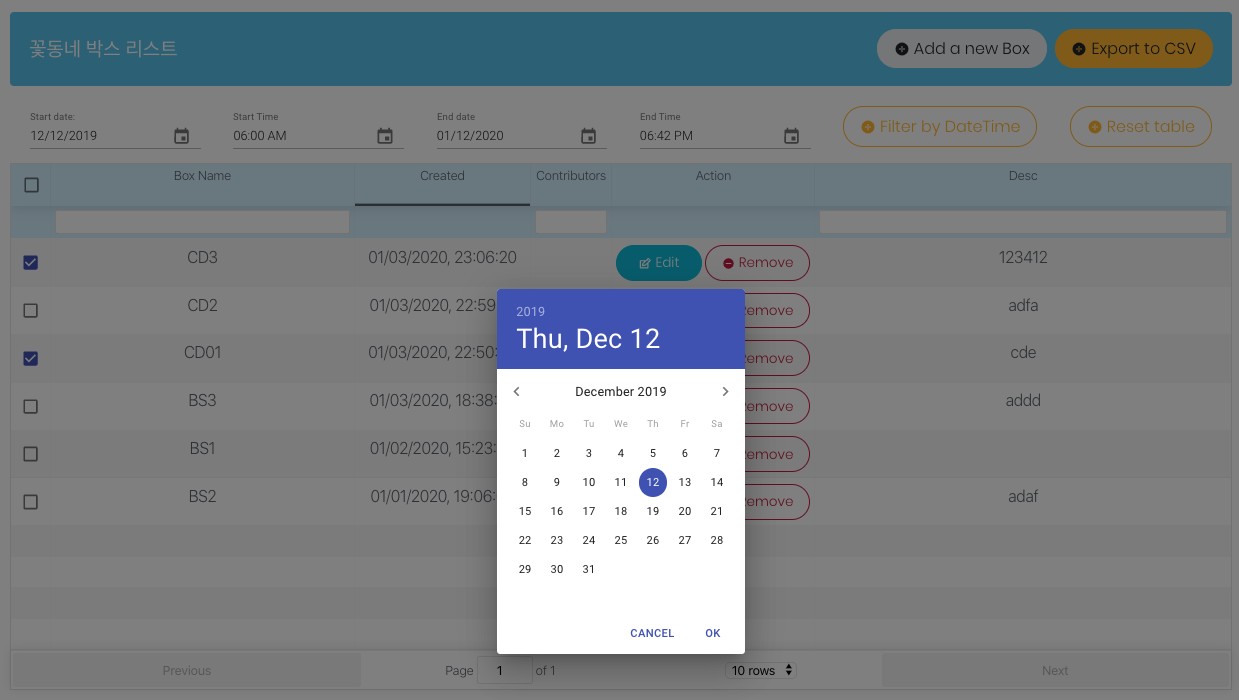
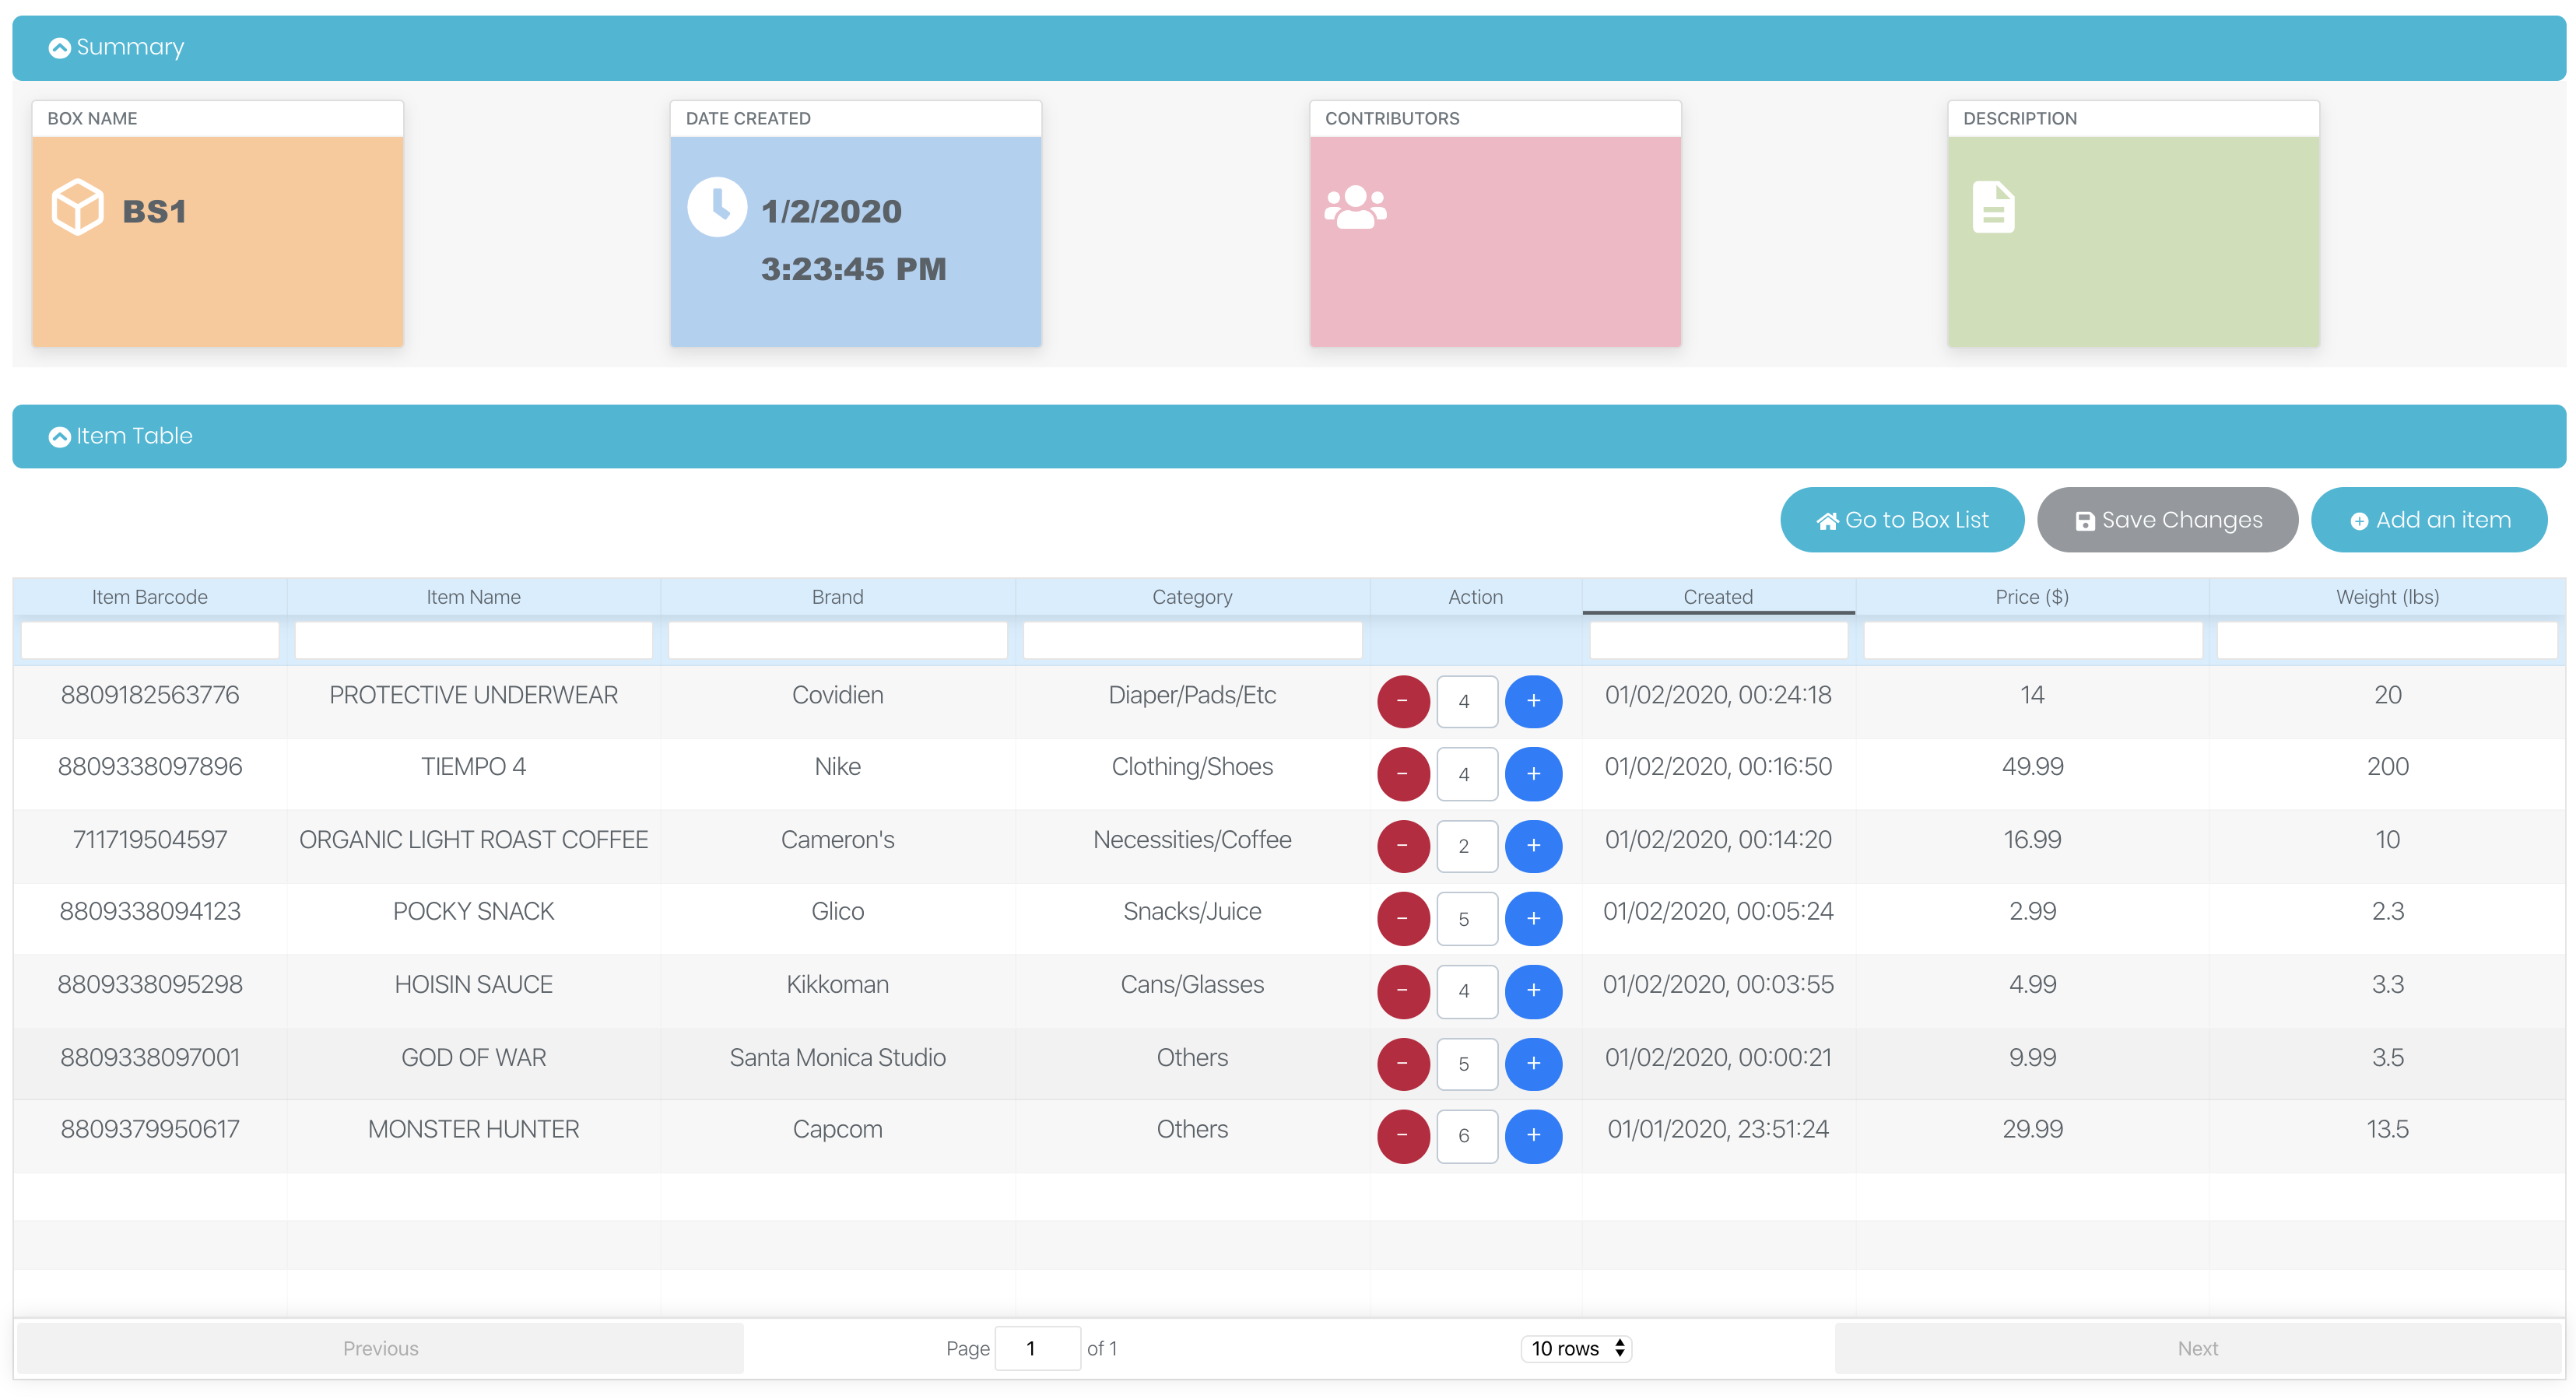
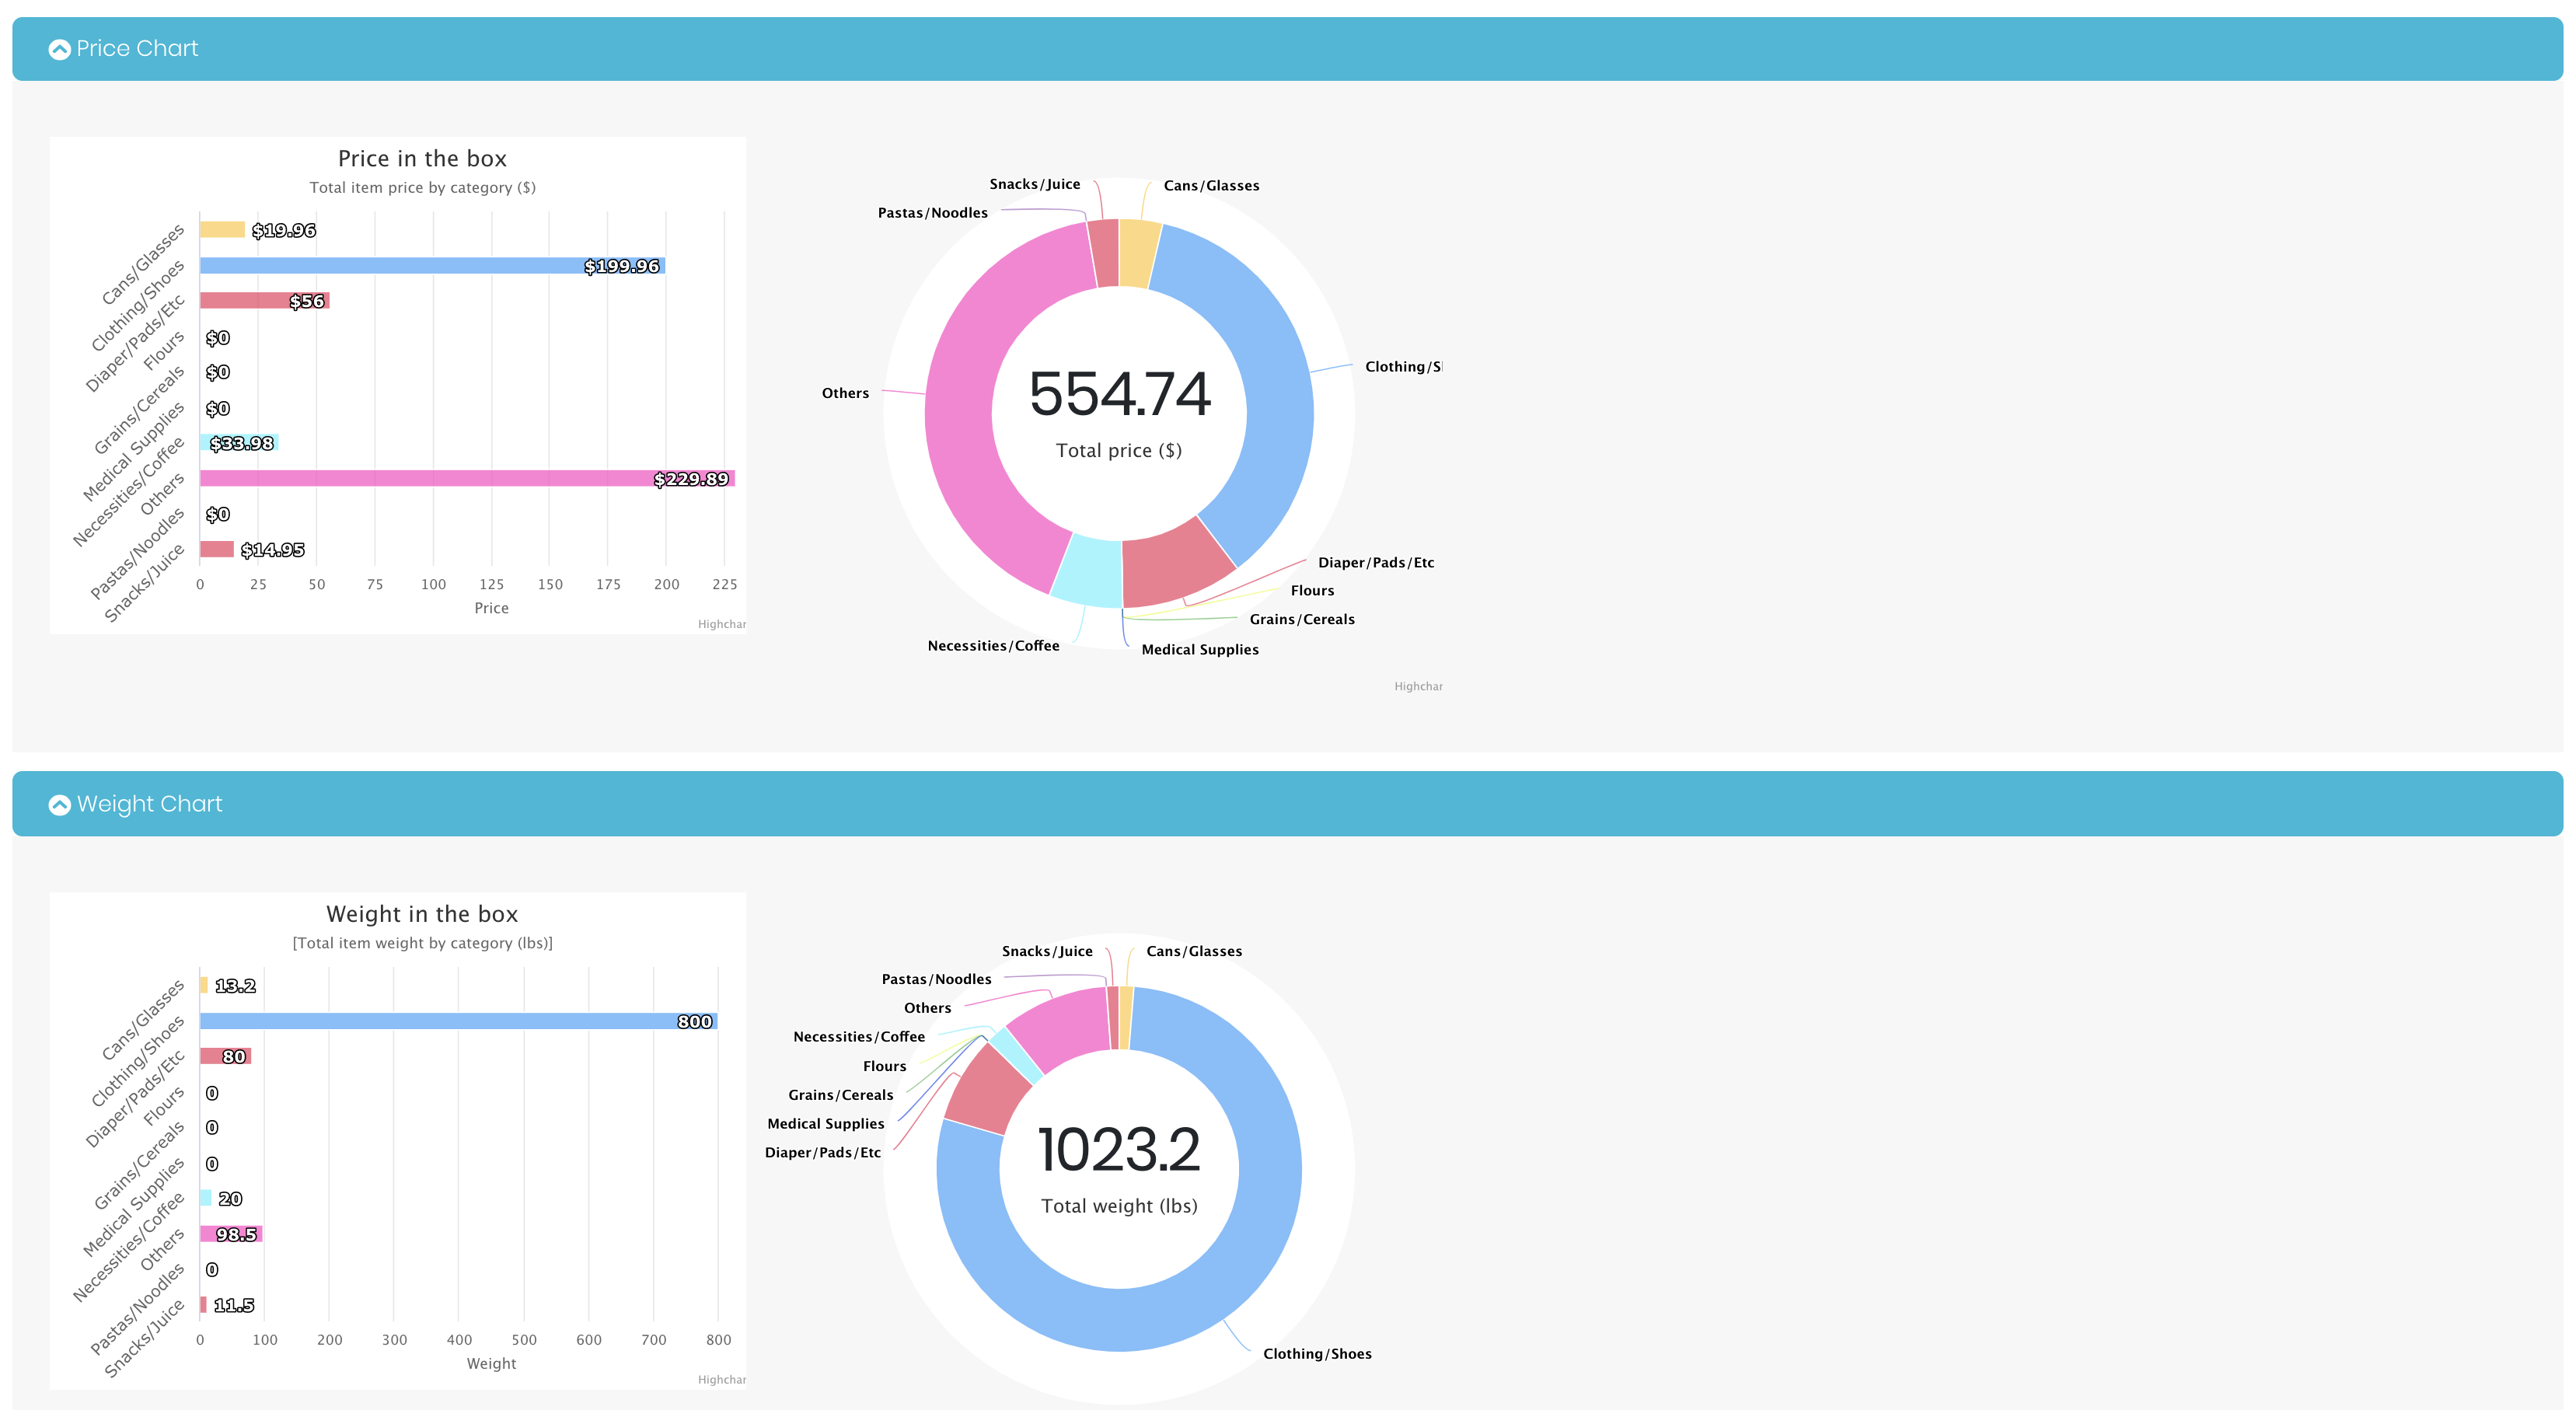
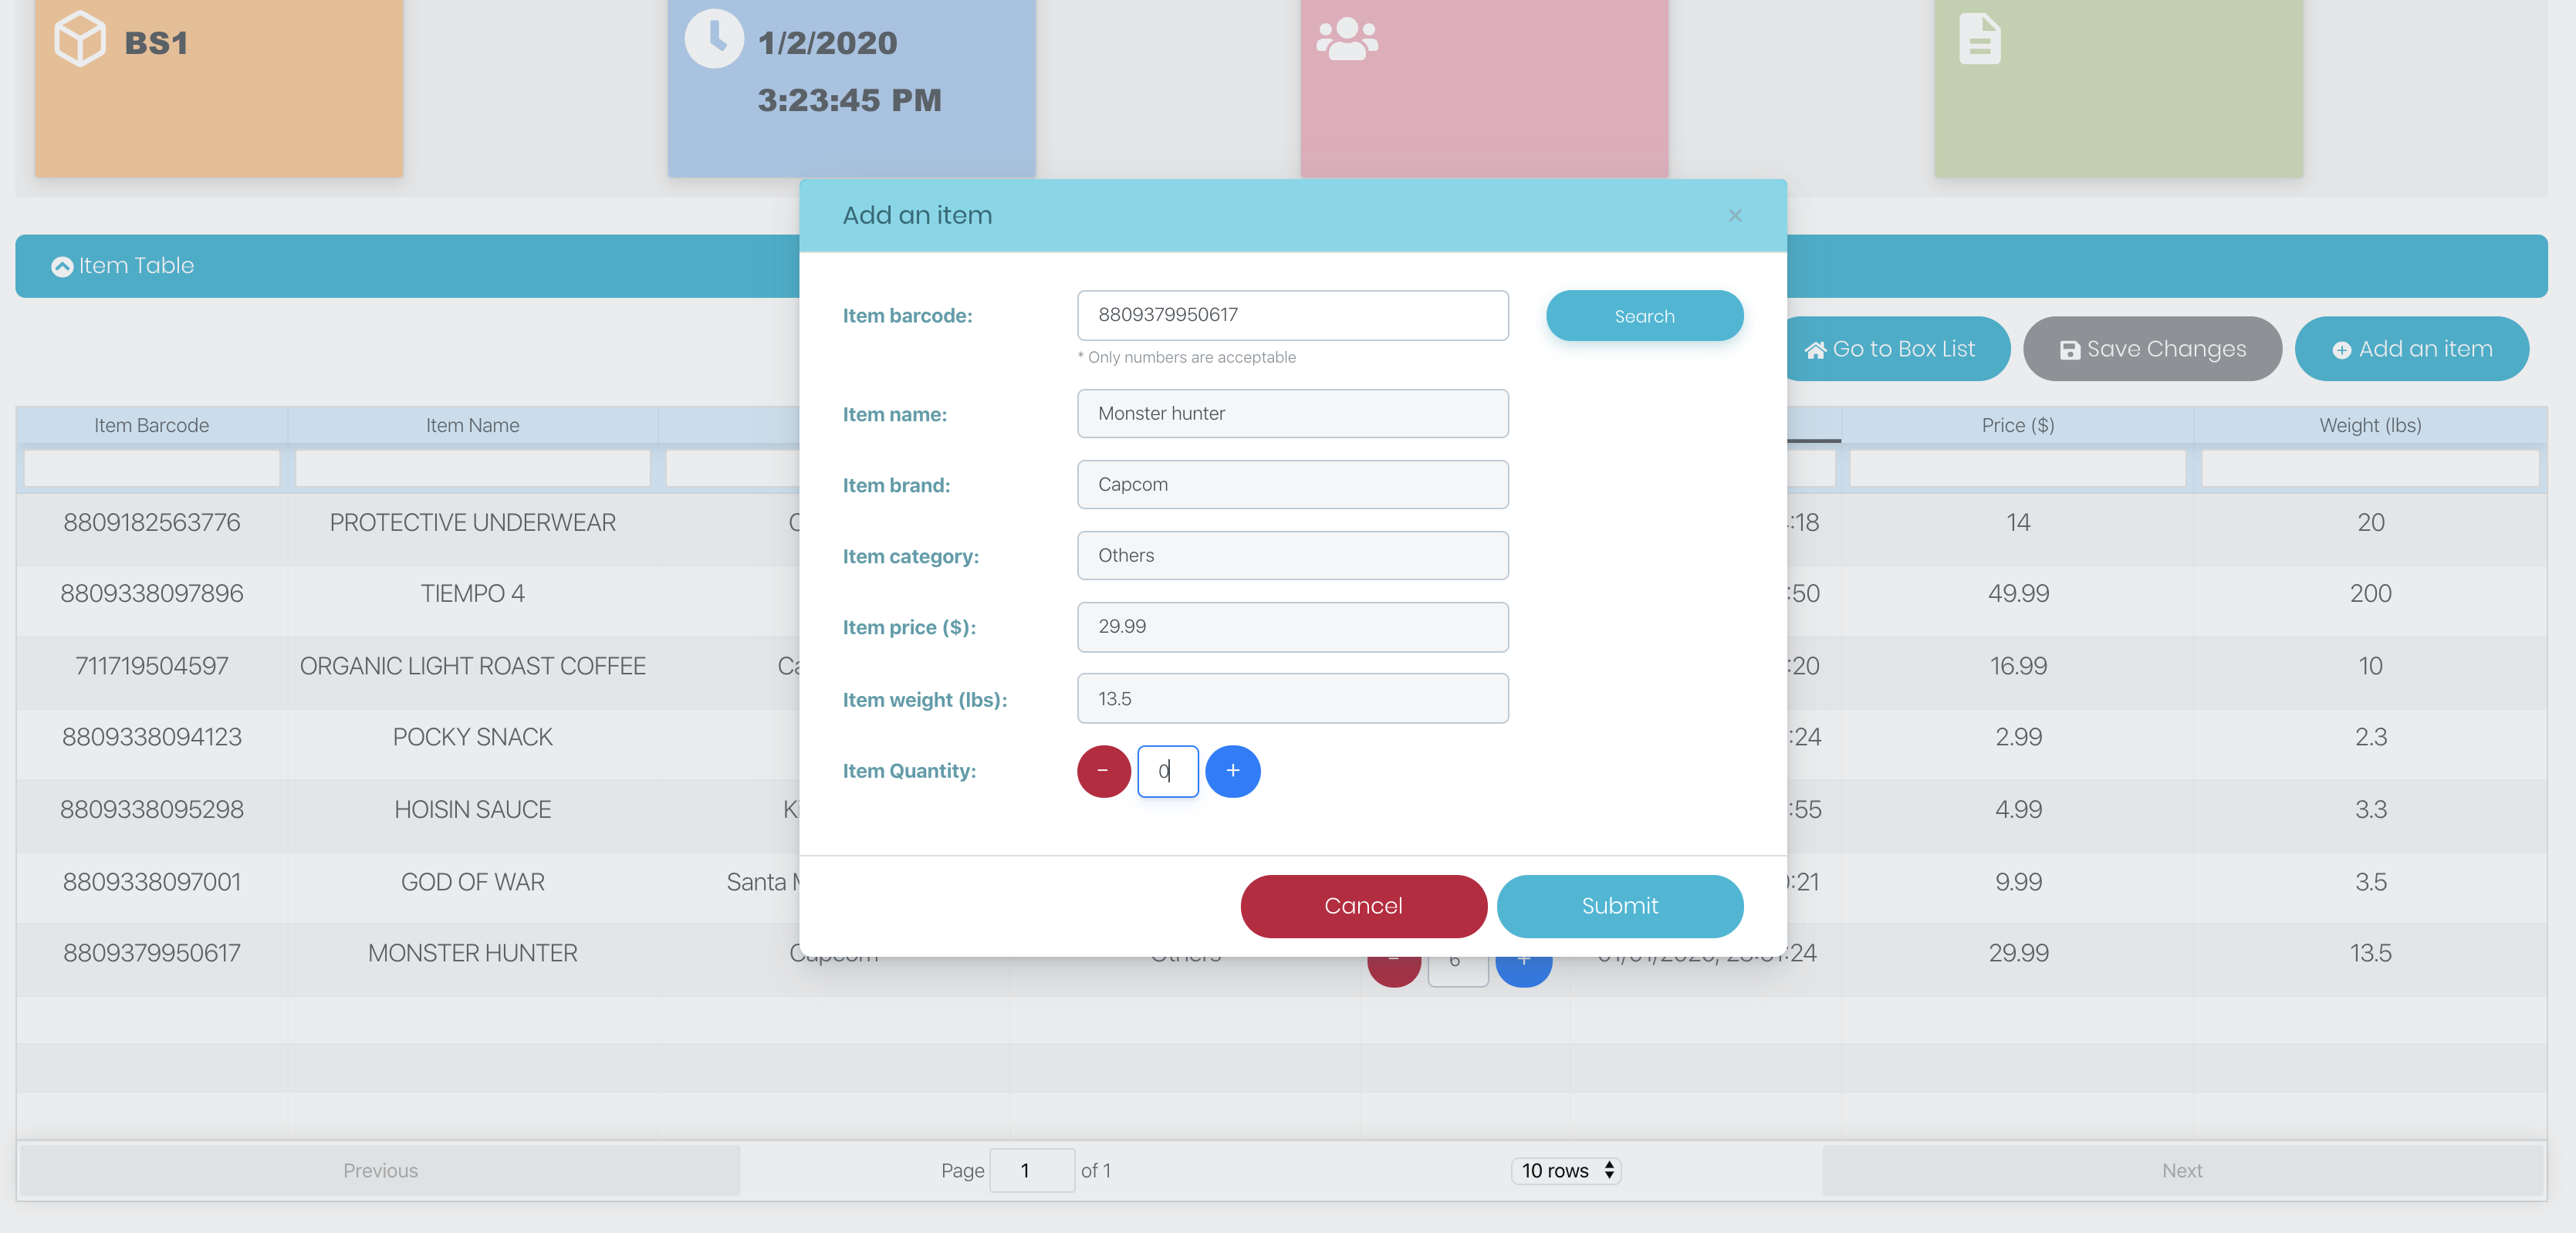
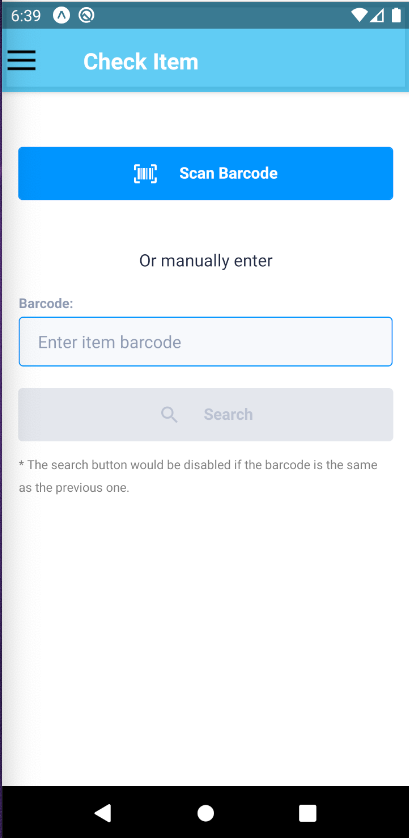
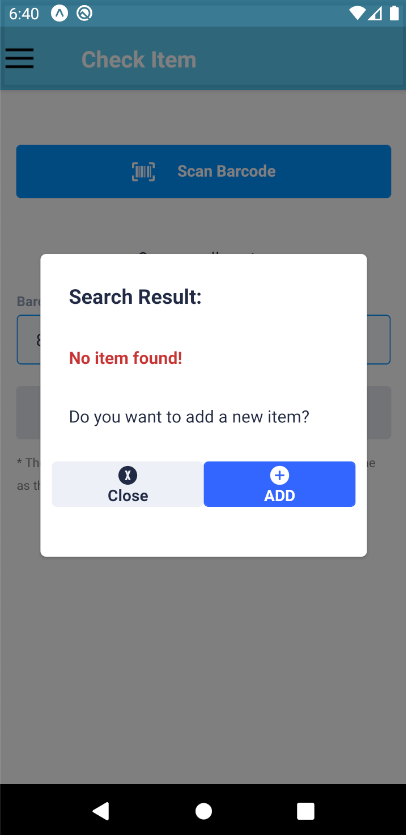
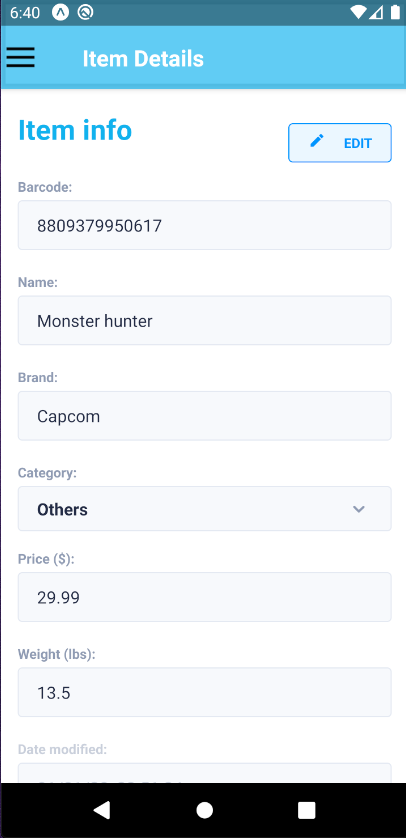
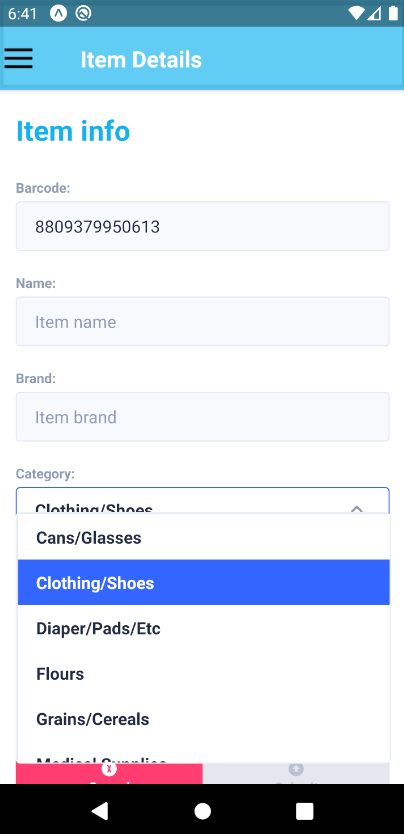
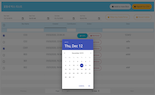
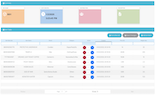
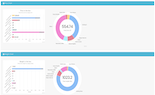
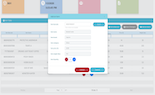
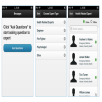
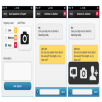
KKottongnae Inventory Management Project

Description
This volunteering project is for the non-profit Catholic organization, KKottongnae in New Jersey, that not only provides food regulary to the homeless, the mentally ill, the elderly, the disabled but also ships the donated items to the KKottongnae branch in Haiti. This project is to develop a cost-effective interactive inventory management application (both web-app and mobile). (slide)
Main programming languages
* React / Redux / ReactNative, MySQL, NodeJS, ExpressJS (All running on the Raspberry Pi 3b+)
DATA SCIENCE PROJECTS
Interactive Indeed Sentiment and Cluster Analyses

Description
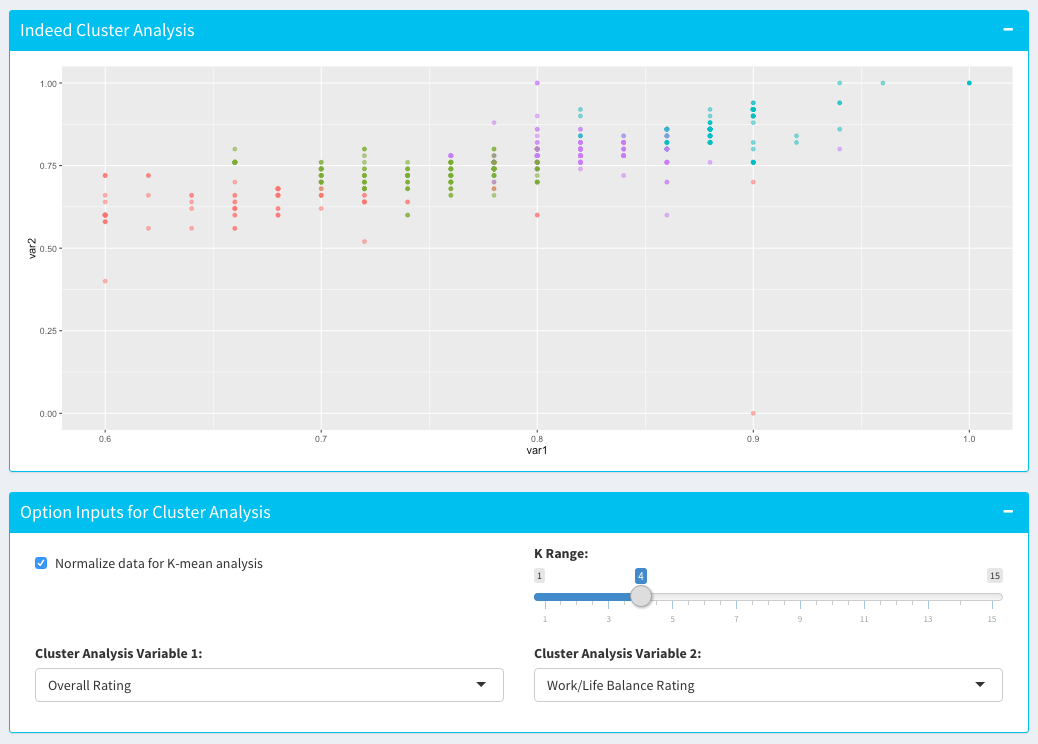
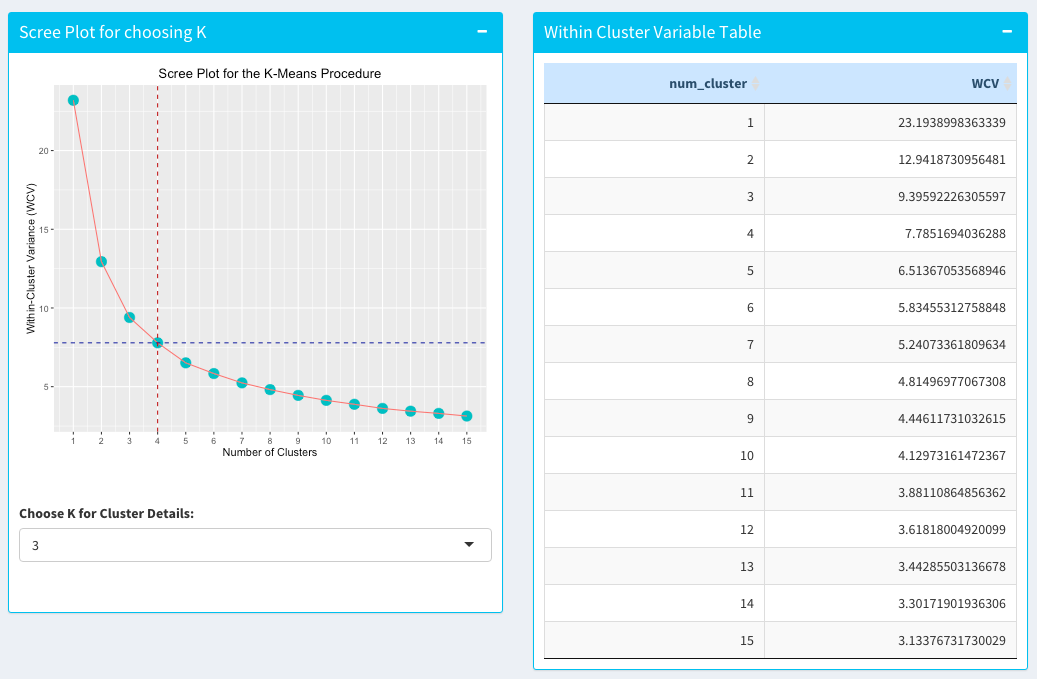
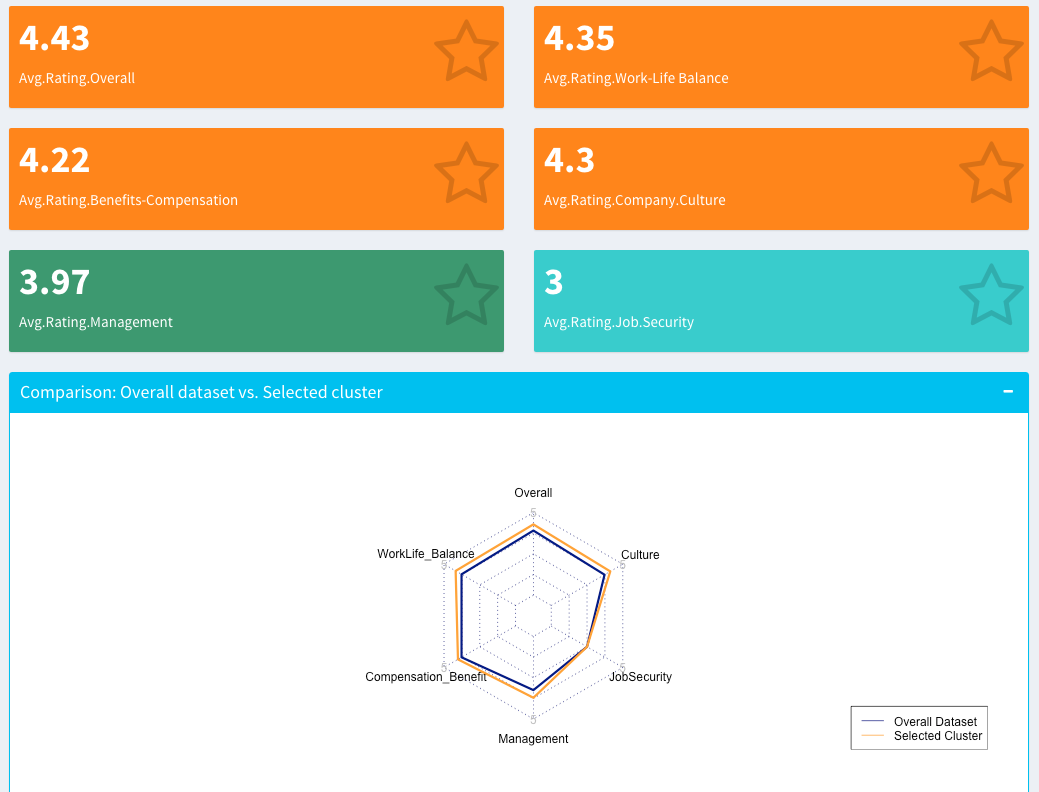
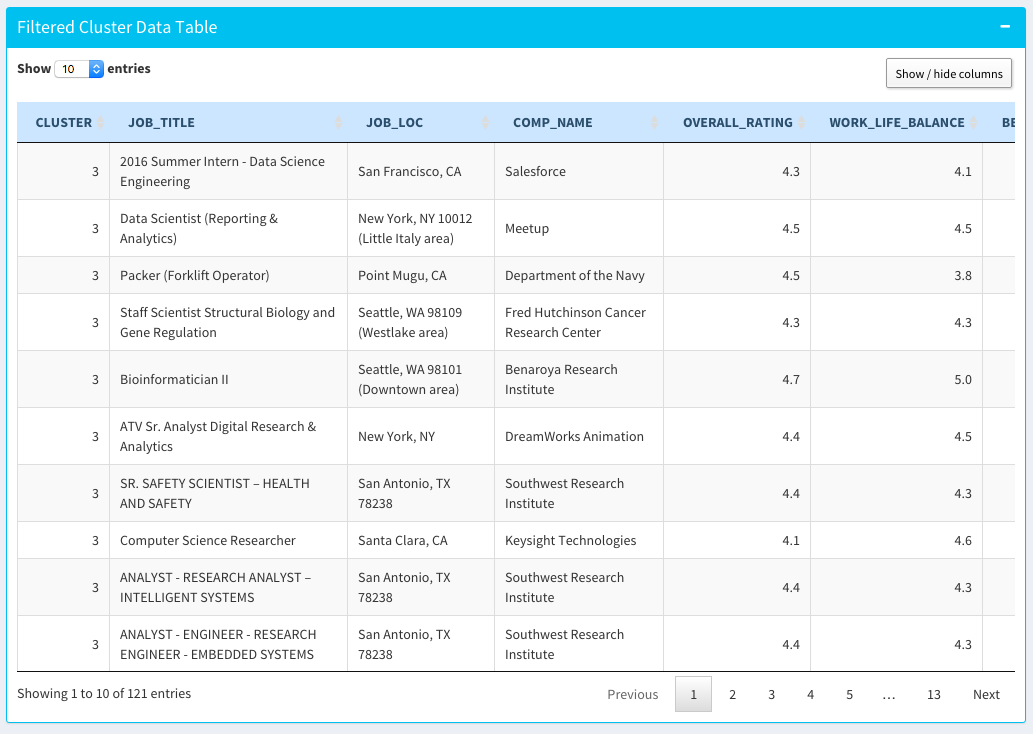
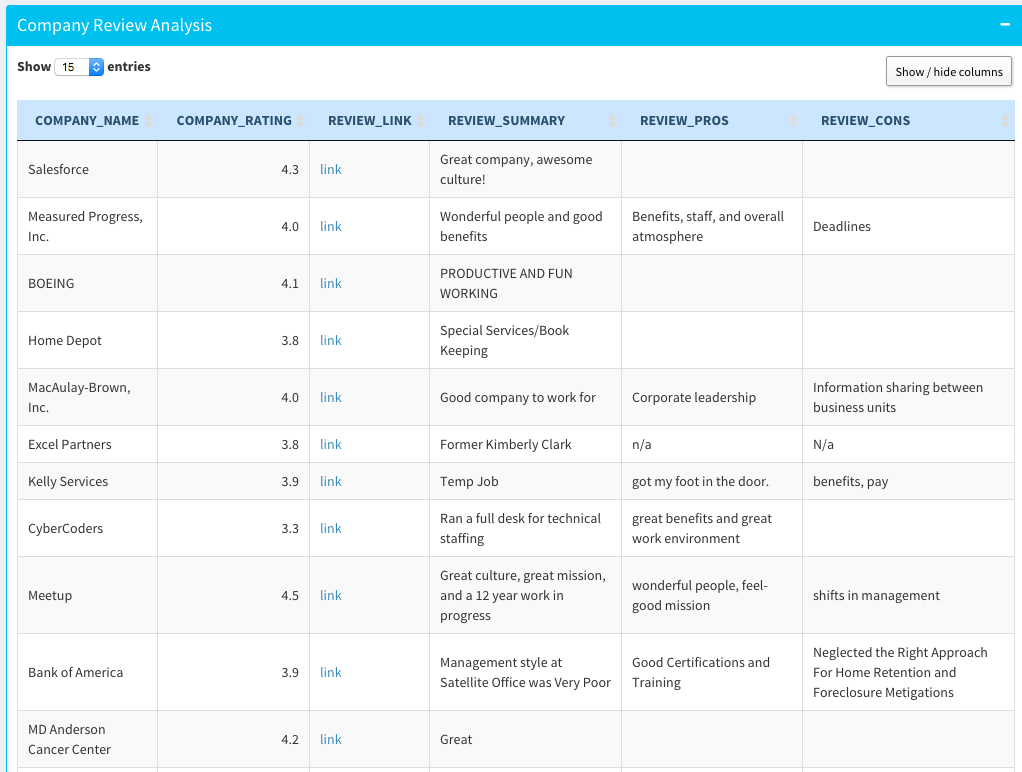
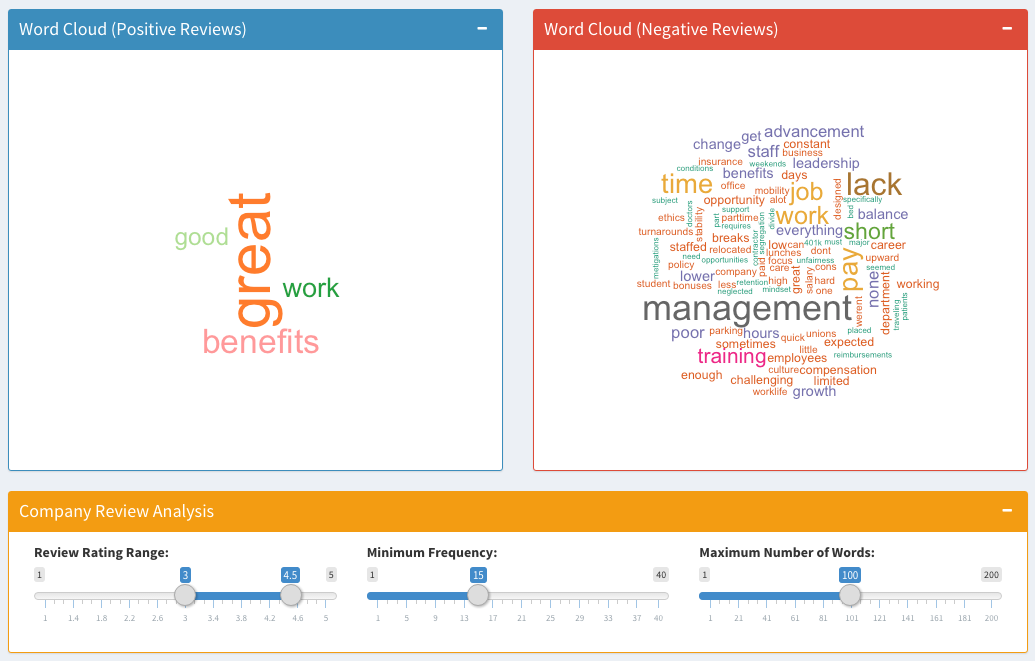
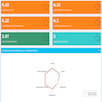
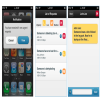
This is an interactive application which embeds K-means clustering and sentiment analysis based on web-scrapped data about jobs and companies from indeed.com and dice.com. The contents were extracted and processed with a variety of Python packages and natural language processing libraries including NLTK. You can read more details about this application in my blog post and try the interactive application.
Main programming language & Library
* Python (BeautifulSoup, Pandas, Re)
* R (dplyr, DT, Shiny, Shiny Dashboard, ggplot2, leaflet, RColorBrewer, tm, SnowballC, wordCloud, fmsb, kernlab)
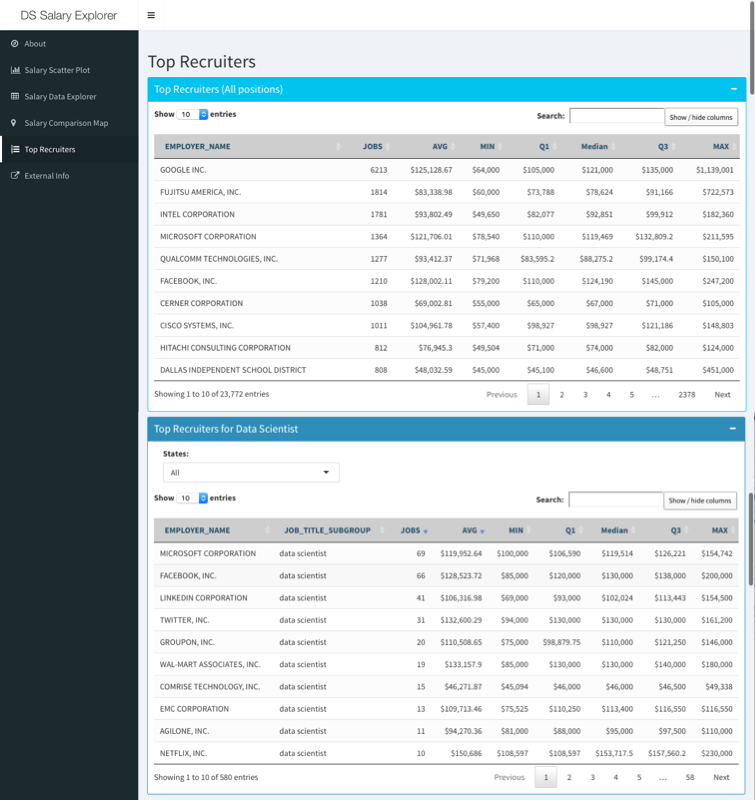
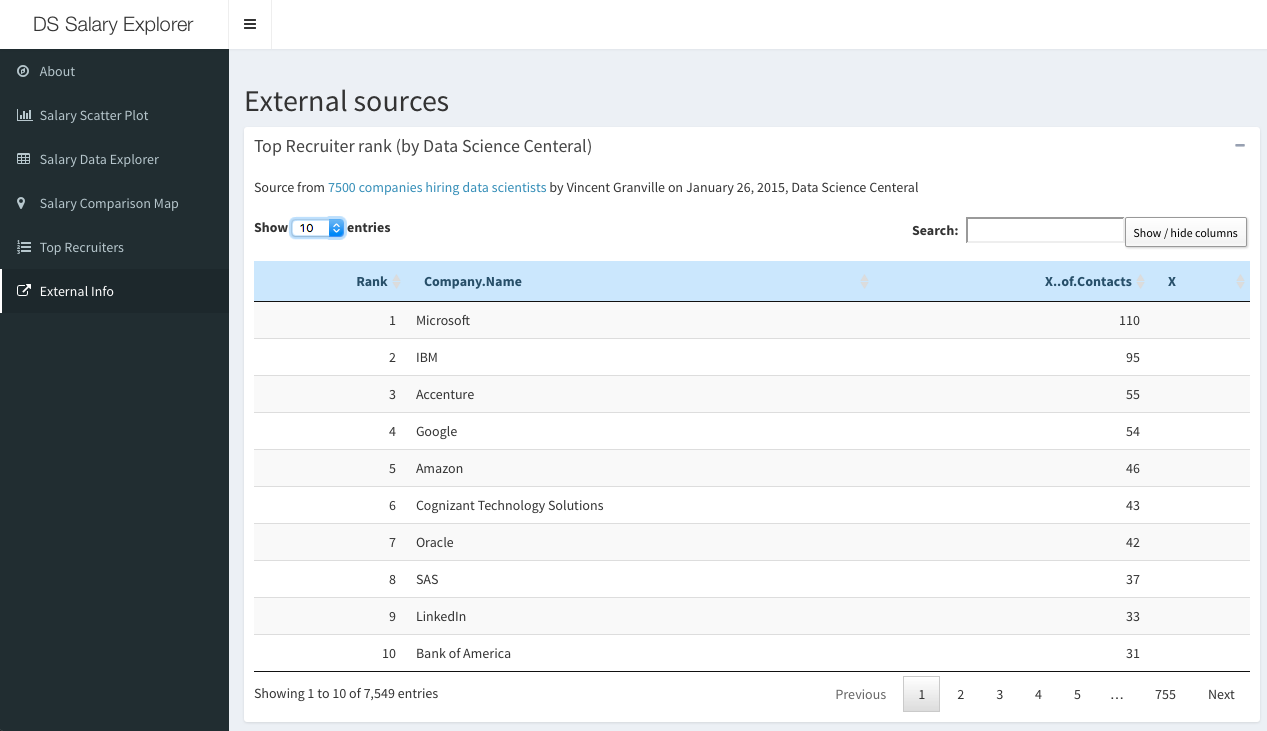
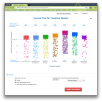
Interactive Data Scientist Salary Comparator


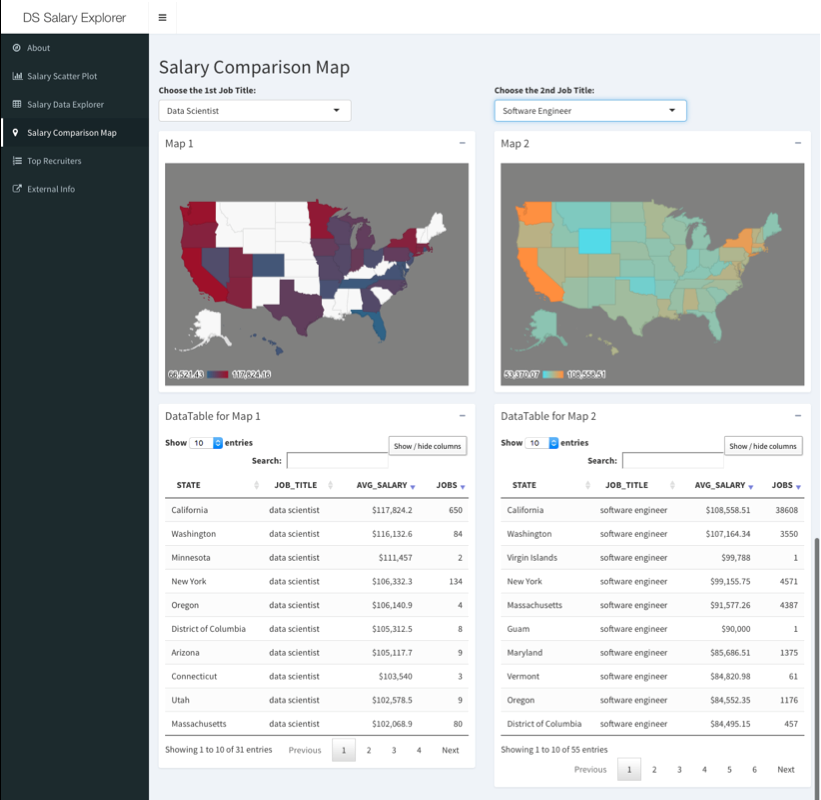

Description
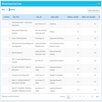
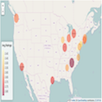
I implemented the Data Scientist Salary Comparator using Shiny package to explore salary data of 8 professions based on the data about prevailing wage of foreign employers in the United States. The 8 professions include Data scientist, Software engineers, Data Analyst, Business Analyst, Management Consultant, Assistant Professor, Attorney, and Teacher. The data set contins the prevailing wage data of foreign employers seeking to file applications in the Permanent Labor Certification Program (PERM), the H-1B, H-1B1, and E-3 Professional and Specialty Occupation Programs, and the H-2B Non-agricultural Temporary Labor Certification Program. The dataset is from the United States Department of Labor, Employment & Training Administration. (Source). You can read more details about this application in my blog post and try the interactive application.
Main programming language & Library
* R (dplyr, DT, Shiny, Shiny Dashboard, ggplot2, leaflet, RColorBrewer, googleVis)
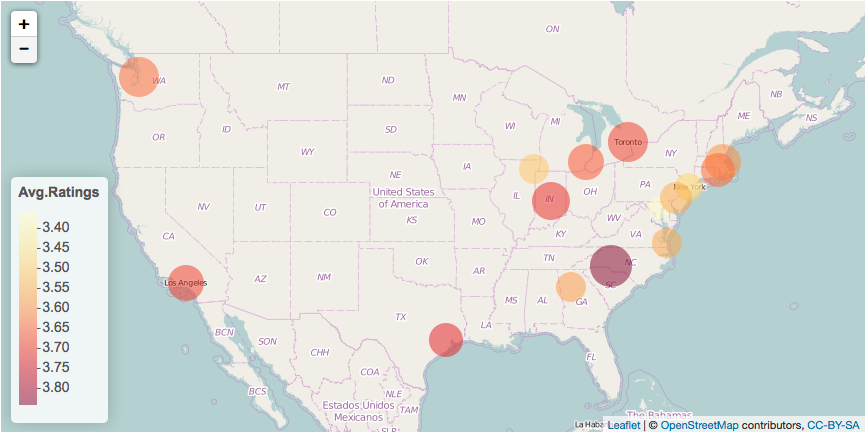
Exploratory visualizations of Yelp academic dataset
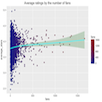
Description
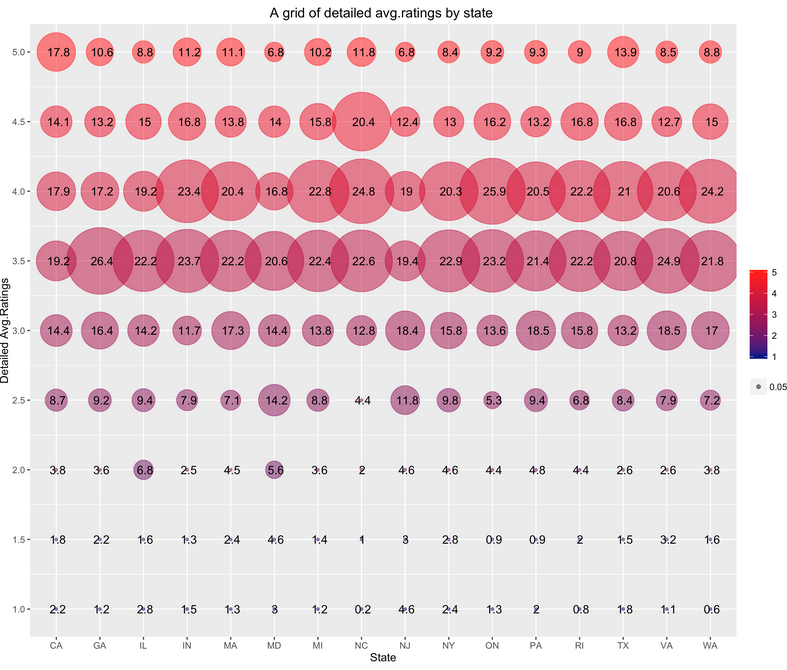
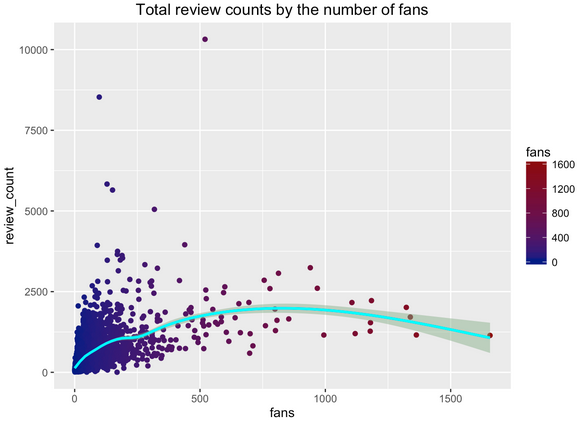
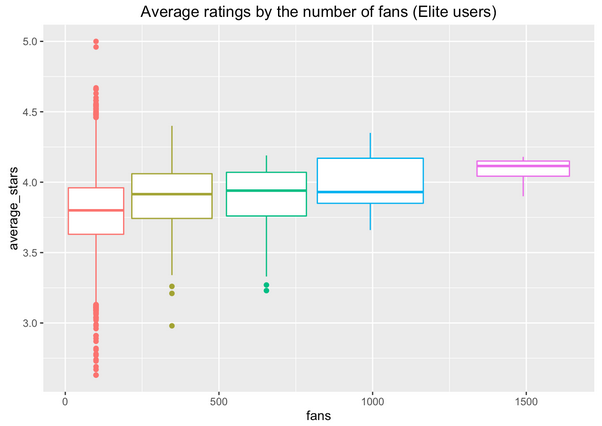
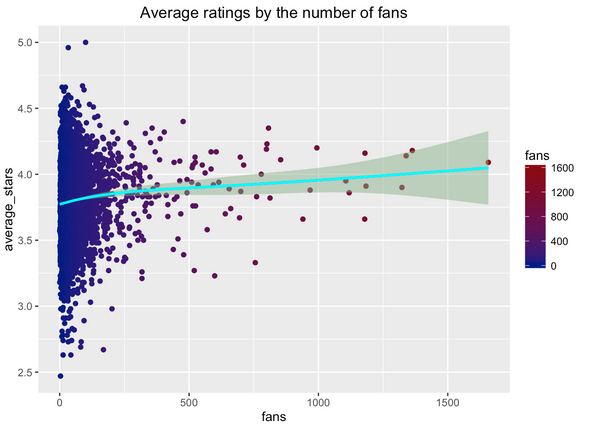
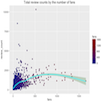
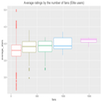
As the first project, I did exploratory data analysis and visualization of the Yelp academic dataset using R, R Markdown, Knitr, googleVis and Shiny. I identified the hidden and interesting relationships between the number of followers at Yelp and average rating frequency as well as average rating scores. Namely, as the number of followers at Yelp increase, users tend to rate more frequently until some point and show tendencies to rate higher. You can read the details in my blog post.
Main programming language & Library
* R (dplyr, DT, Shiny, ggplot2, leaflet)
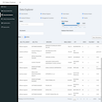
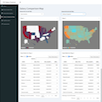
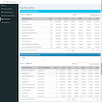
Interactive Yelp Data Explorer

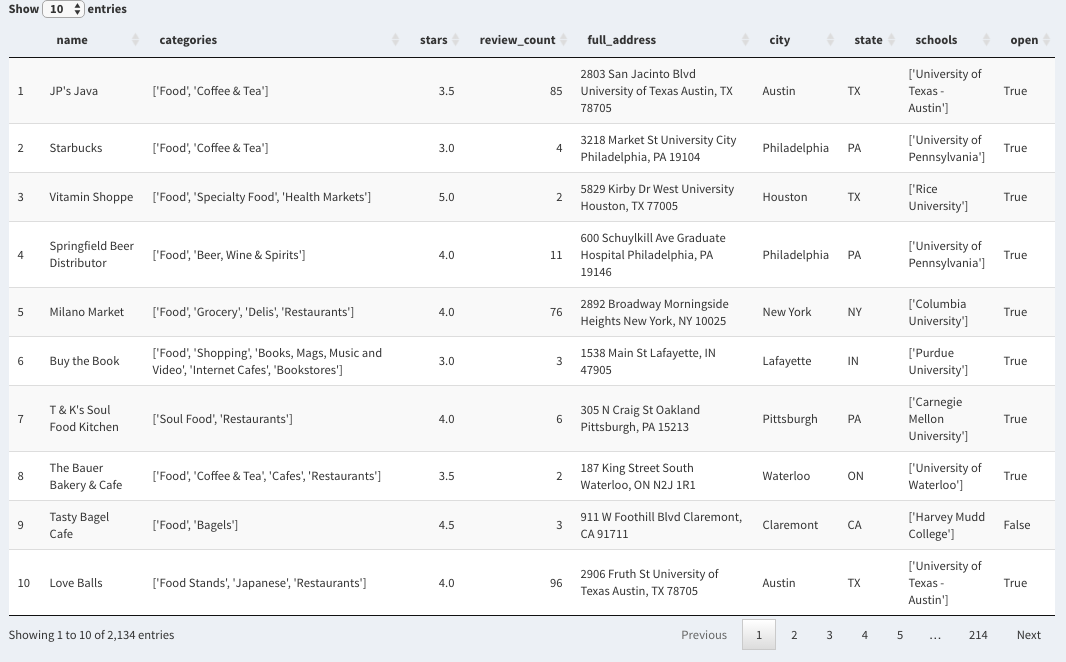
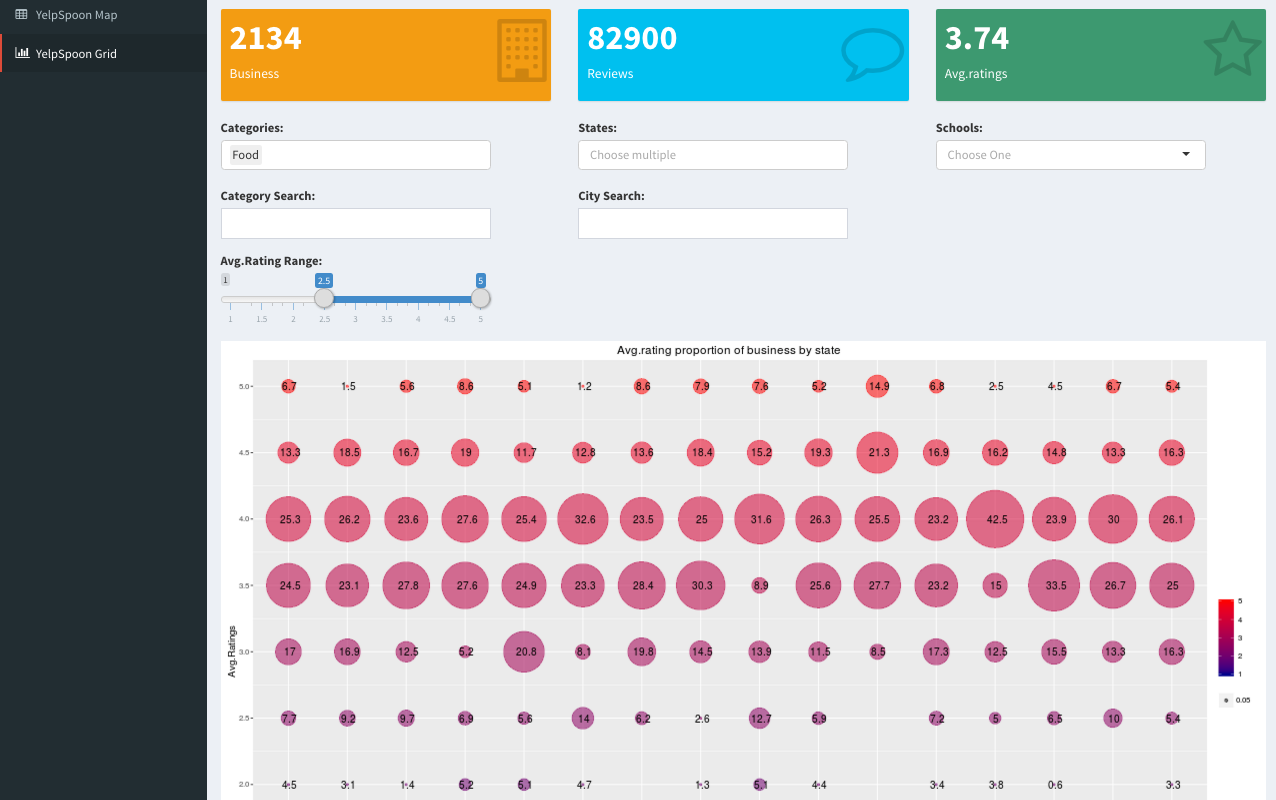

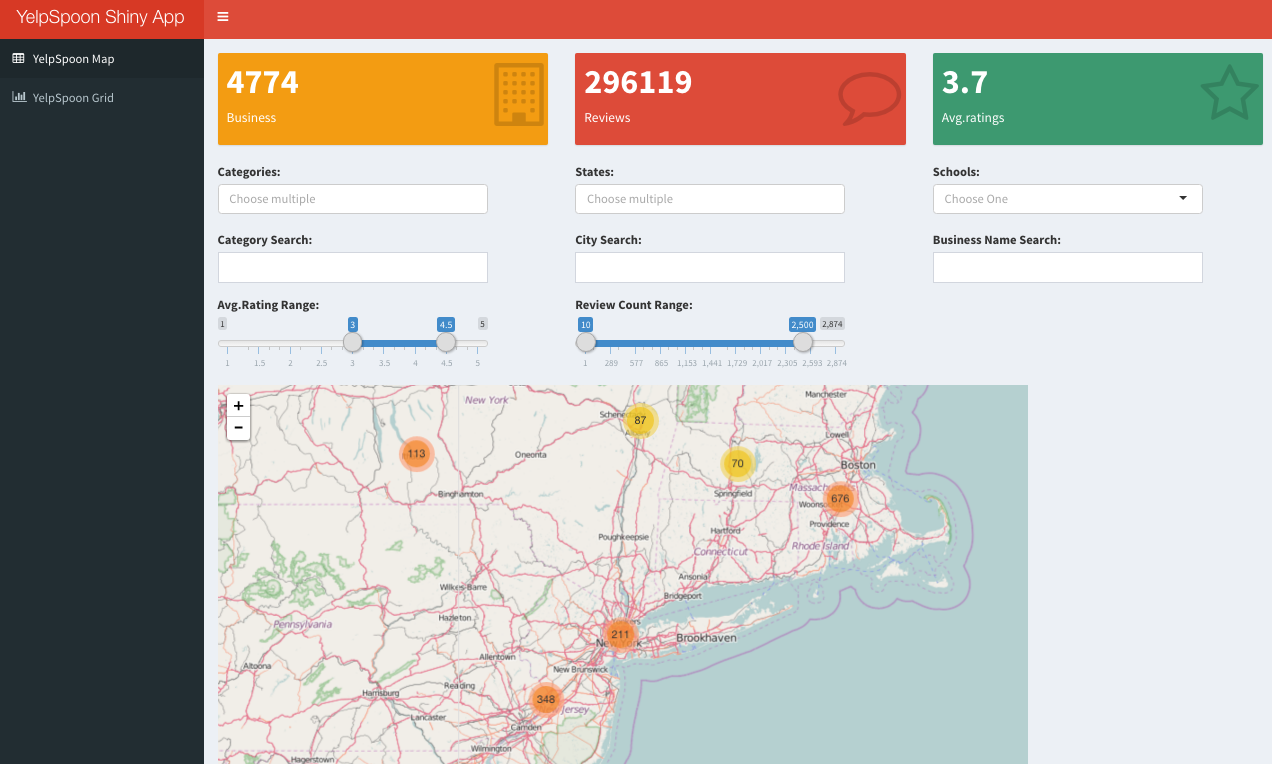


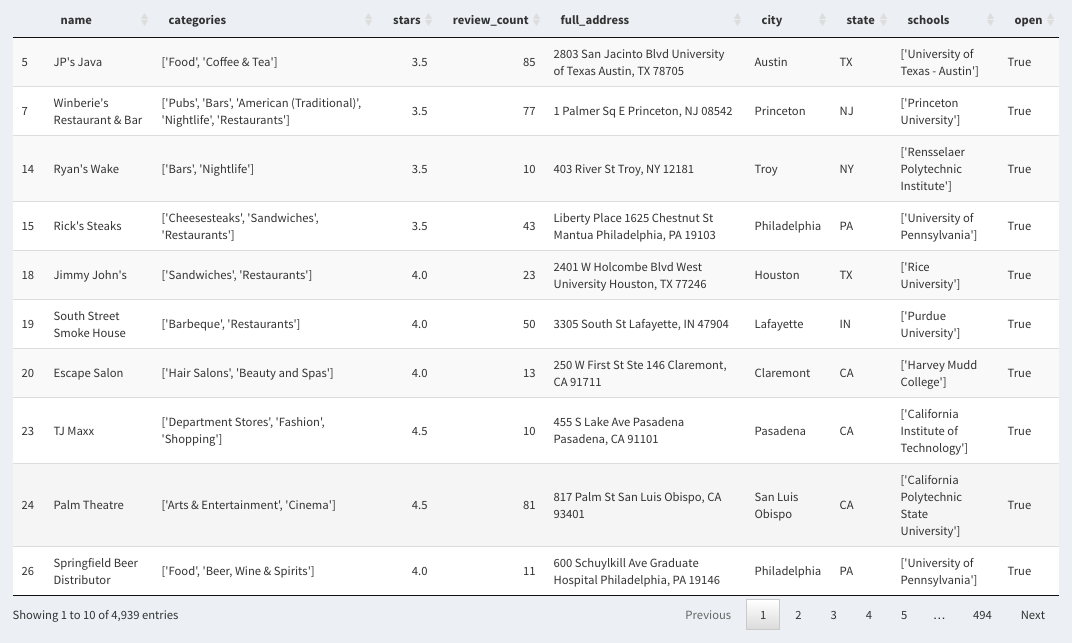
Description
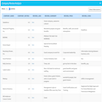
Extending to the 'Exploratory Visualization Analysis of Academic Yelp dataset', I developed an interactive application which provides restaurants information in users' areas of interests using R pagckages. Through multifaceted interactive components such as data explorers, scatter plots, and comparison maps, users of applications can get broad and deeper understanding of various aspects of the data sets. You can try the interactive application.
Main programming language & Library
* R (dplyr, DT, Shiny, Shiny Dashboard, ggplot2, leaflet, RColorBrewer, googleVis)
DataSci4Good Wise project
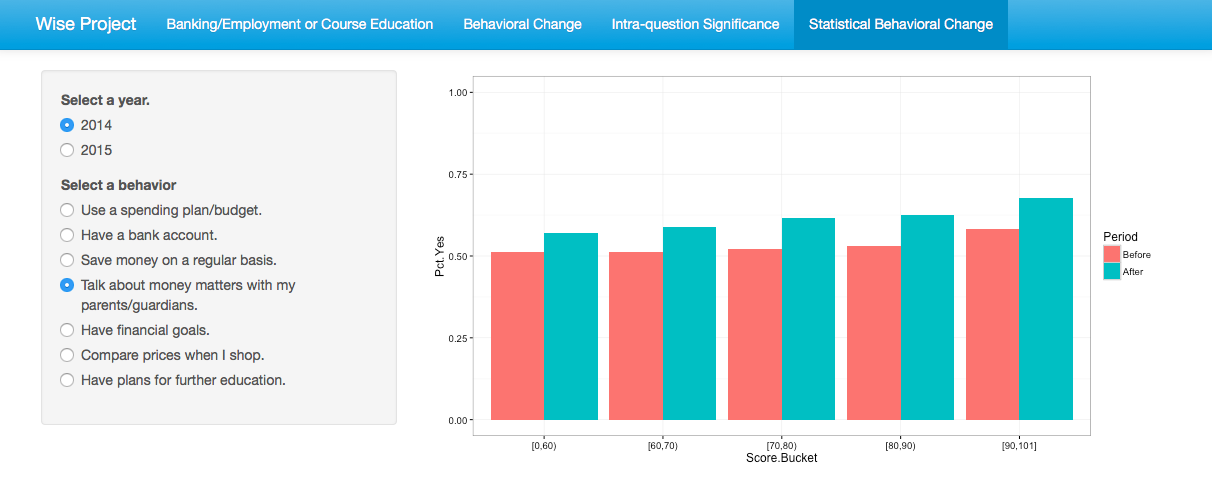
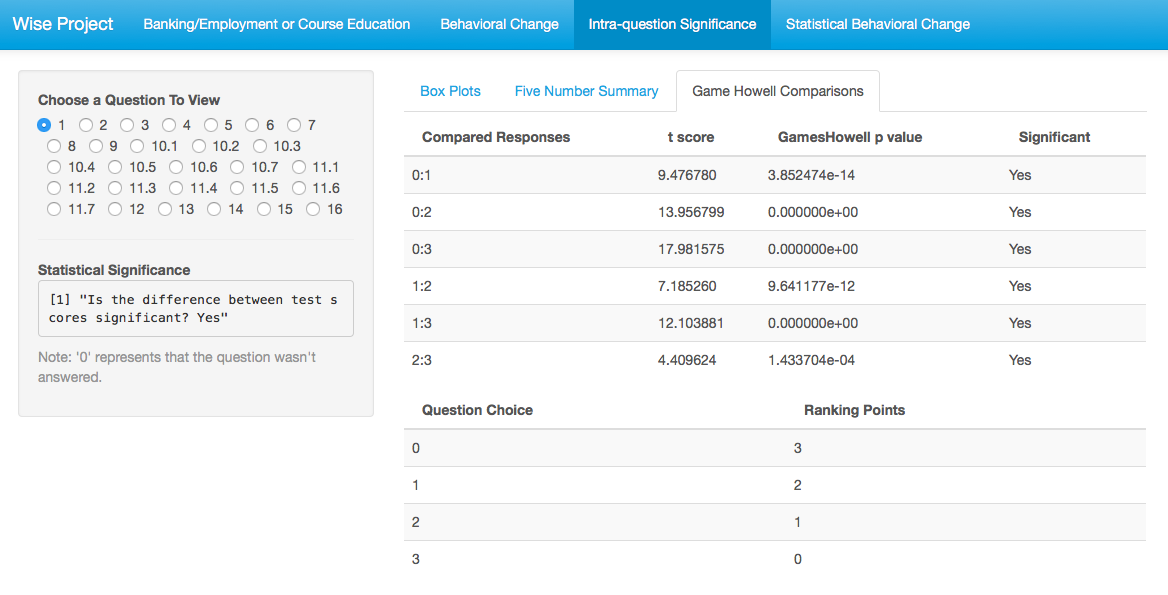
Description
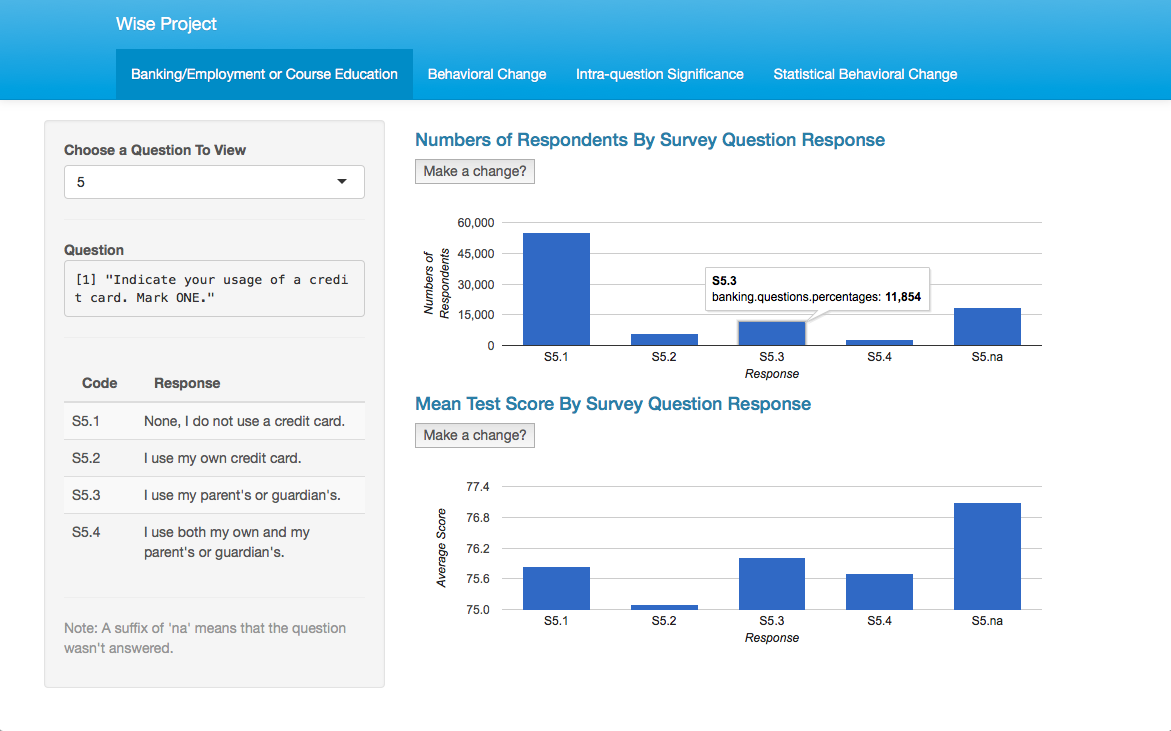
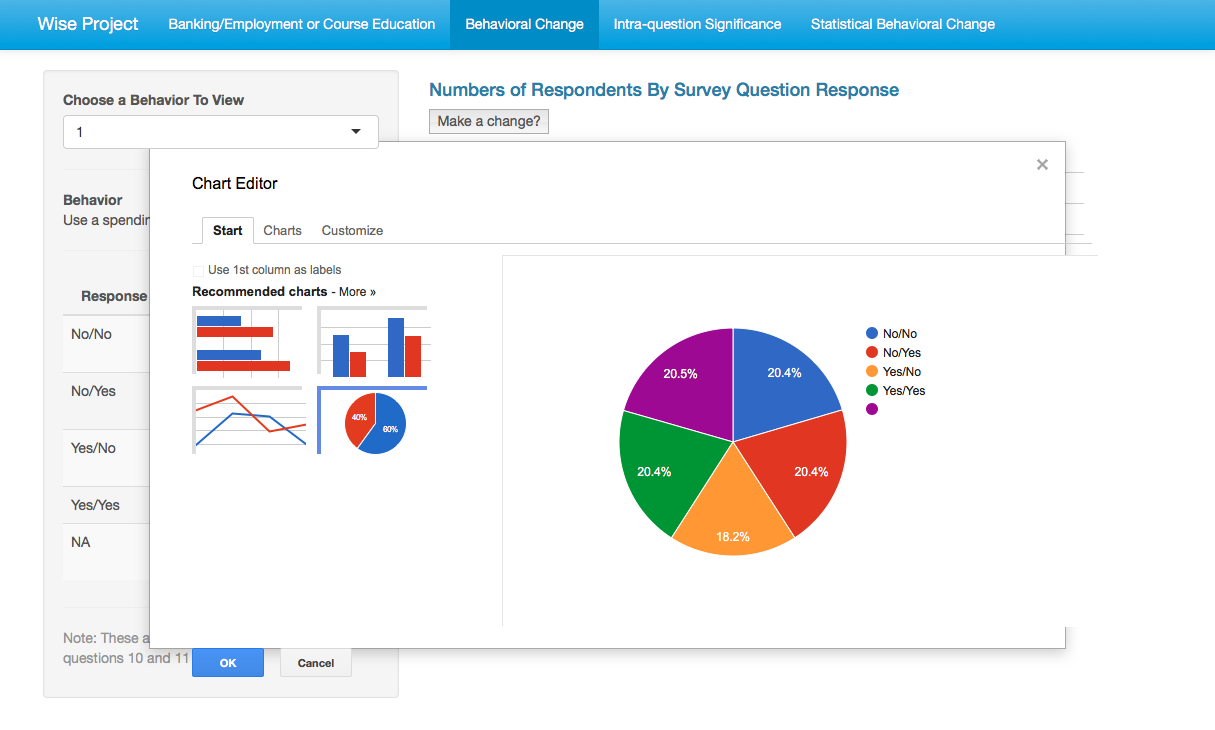
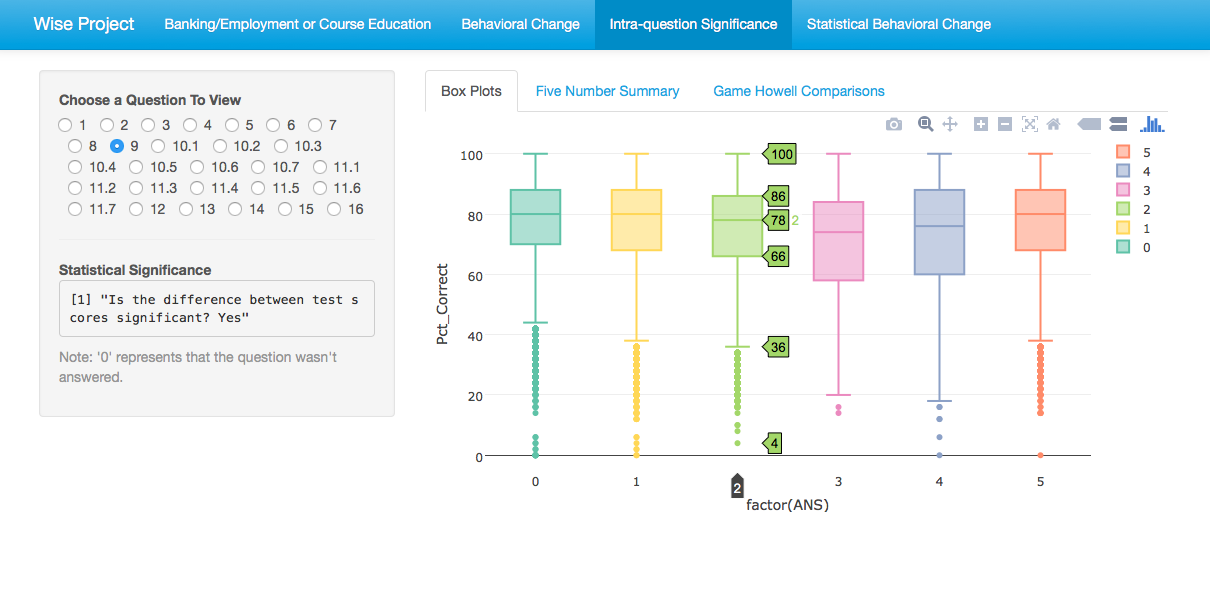
Currently collaborate with clients from the DataSci4Good for the Wise project which is designed for young people to develop financial literacy. Our project team currently tries to implement improved visualization and embed components of recommendation system and statistical analysis to the existing Shiny dashboard application for efficient learning experience.
Main programming language & Library
* R (dplyr, DT, Shiny, ShinyDashboard, ShinyThemes, ggplot2, plotly, googleVis, userfriendlyscience, tidyr, broom)
Kaggle BNP Paribas Cardif project
Description
Participated in the Kaggle Competition (Kaggle BNP Paribas Cardif) project to predict category of user claims based on features available in the early process of claim management from a large data set (30~40% missing and anonymized). I continuously utilized multiple supervised learning methods for better performance and higher prediction accuracy using decision tree, random forest, gradient boosting model, and xgboost.
SOFTWARE DEVELOPMENT PROJECTS
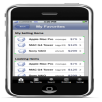
HamkeRun


Description
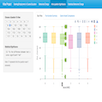
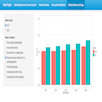
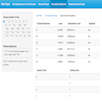
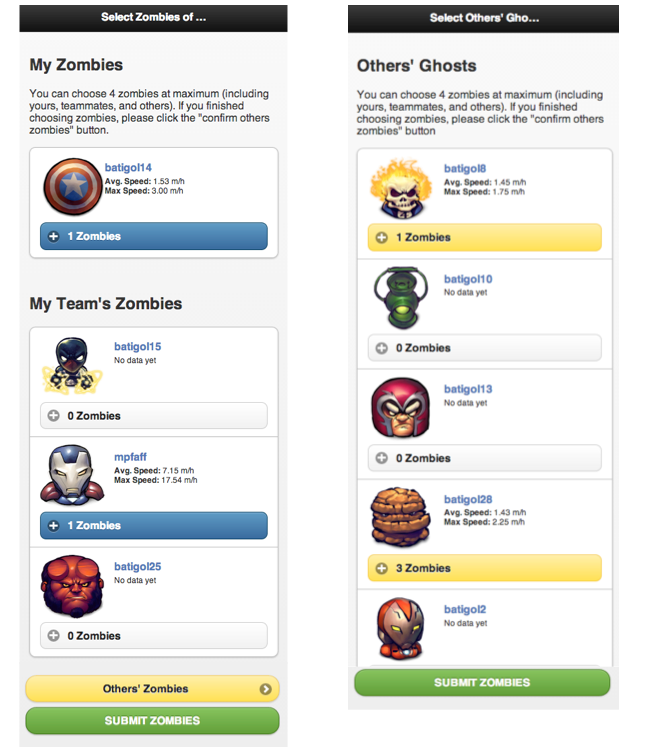
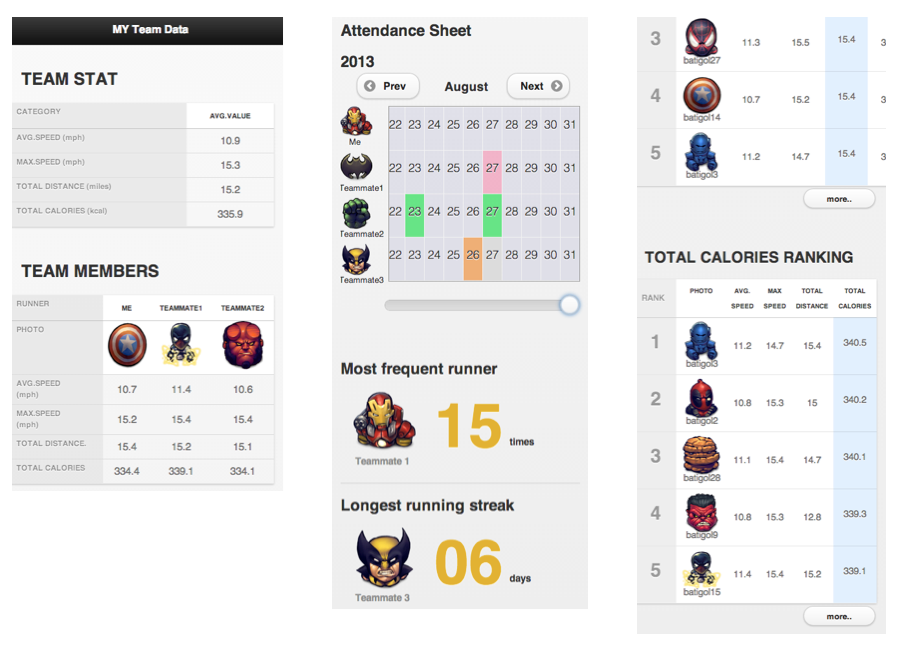
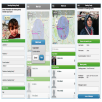
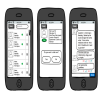
The HamkeRun is a mobile application (currently android) which is designed to enable people to increase and sustain their motivation to run more and more frequently. The application combines elements of persuasive technology, game-like features, information visualization, and social support. Running activities of users (geolocations, running speed, and calories) are automatically captured while they run. Users of the application are able to view their visualized running activities and their progresses as well as their team members'. The game-like features (gamification) such as comic characters and social support with / without team members also allow users to be more immersed in the activities and interactions (with others), thus to get motivated more and more.
Main programming language & Library
HTML5, CSS, Javascript, jQuery mobile, Kinvey BaaS, PhoneGap, MapQuest SDK, HighChart SDK
My Part
Mobile, Front-end & back-end implementations, Usability, User analysis, User Interviews, requirement gathering, usability testing
Publication
Moon, S. P. (2015). Hamkerun: Mobile infoVis app towards sustainable motivation in a context of running (Doctoral dissertation, INDIANA UNIVERSITY). (link)
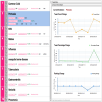
Shared healthcare decision space tool


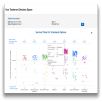
Description
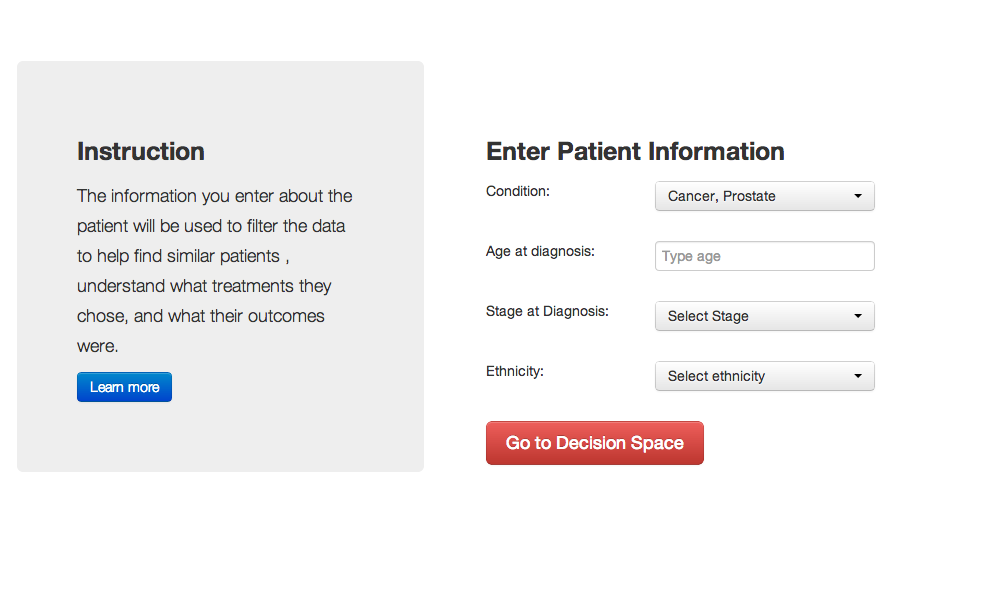
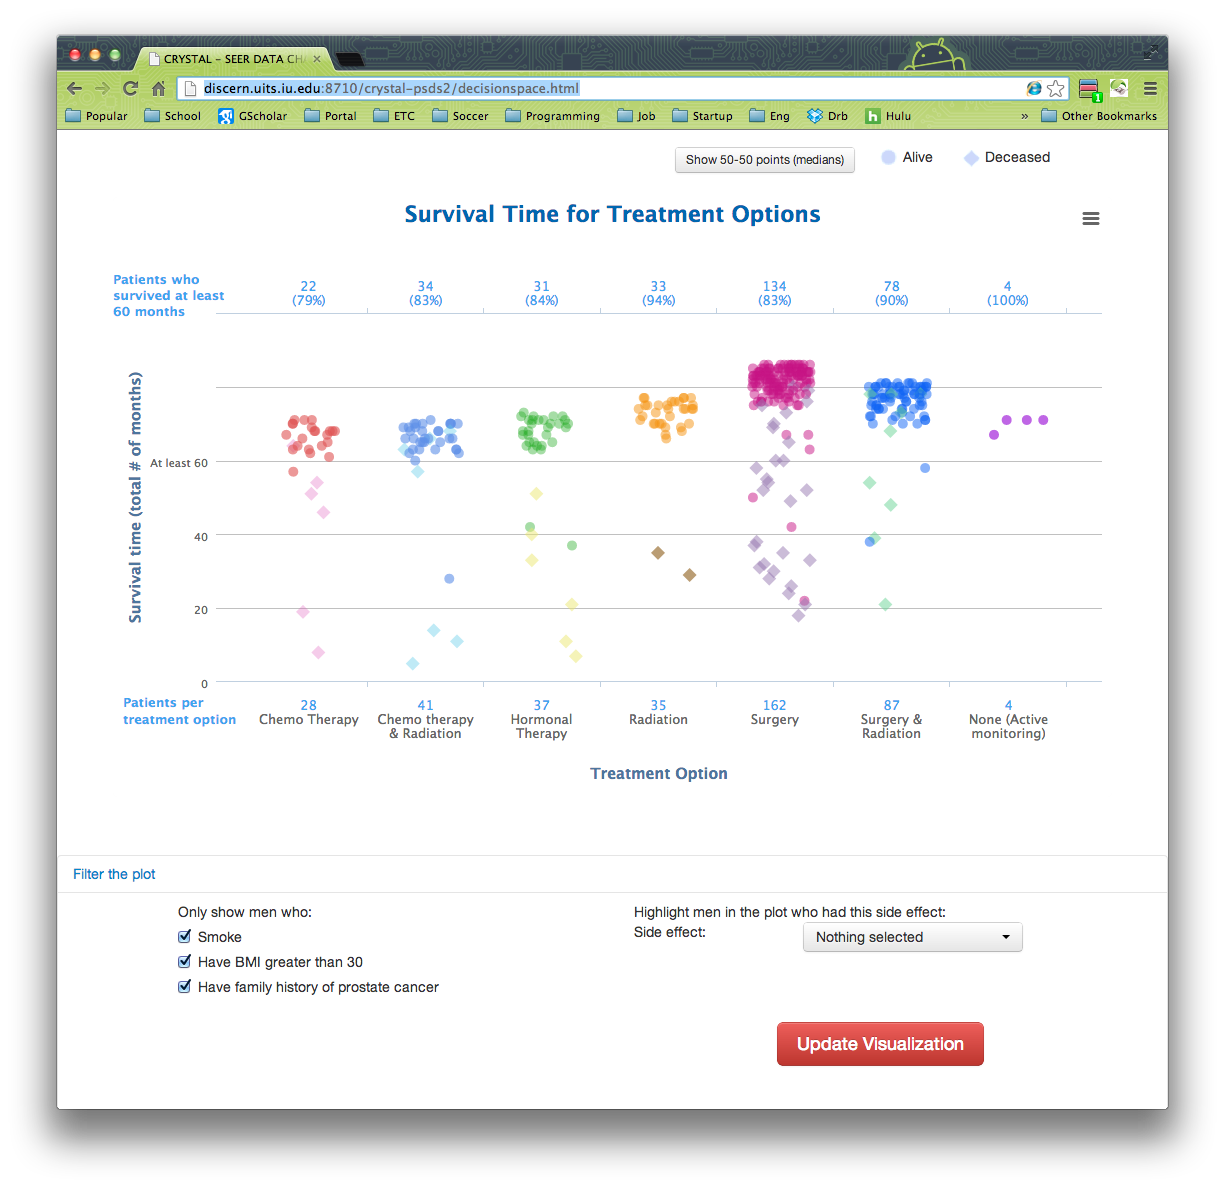
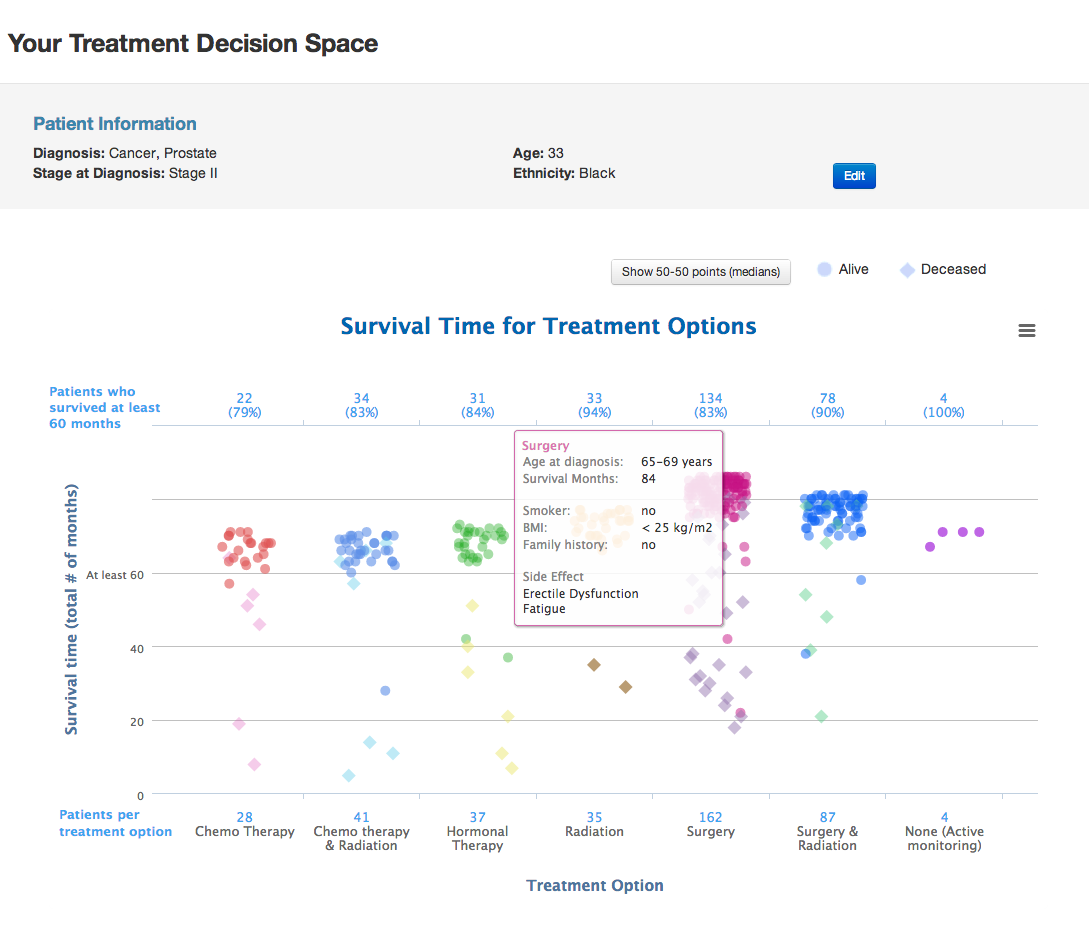
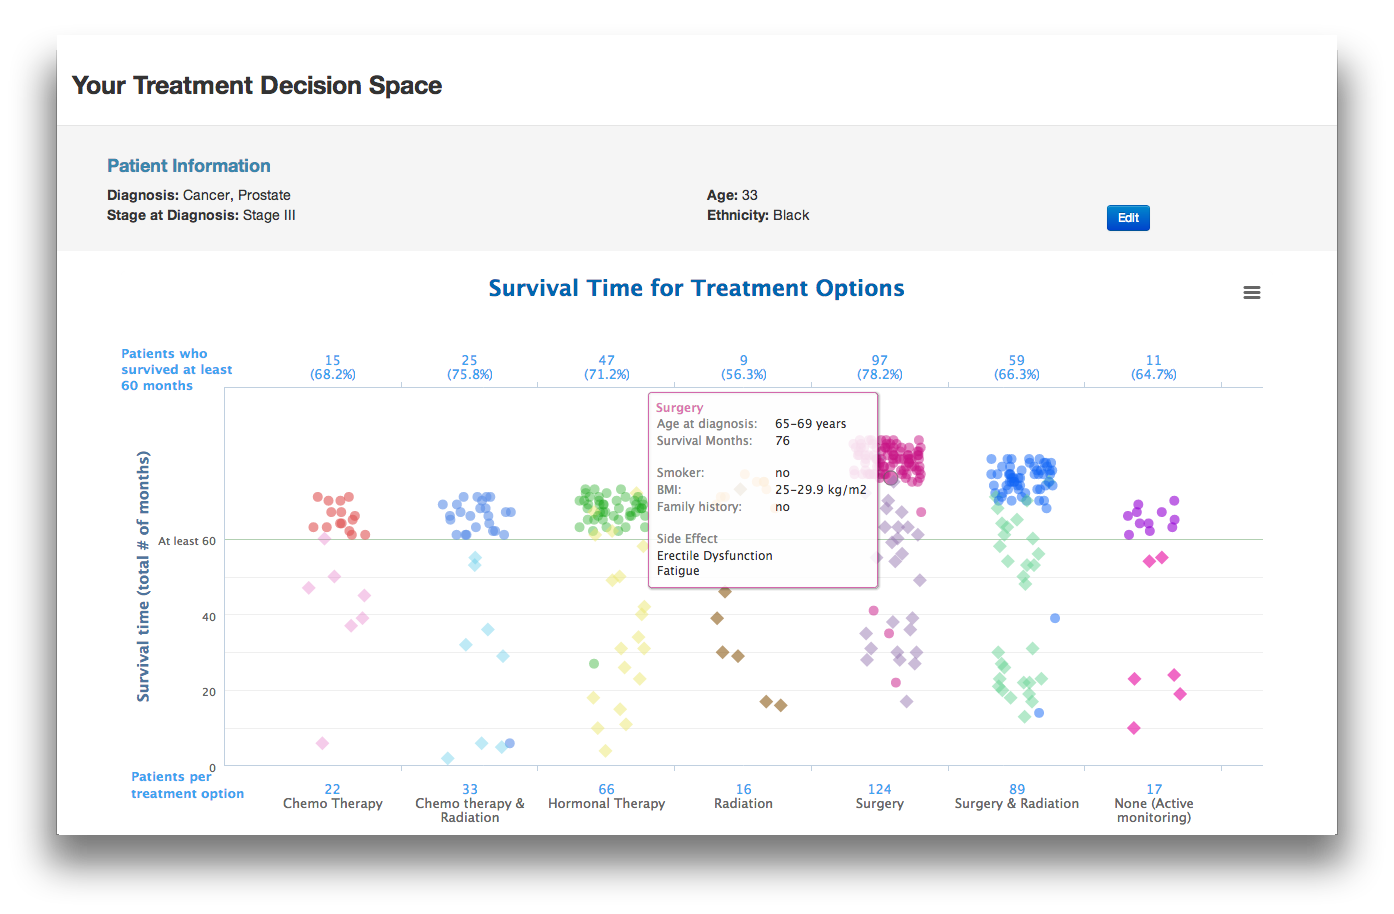
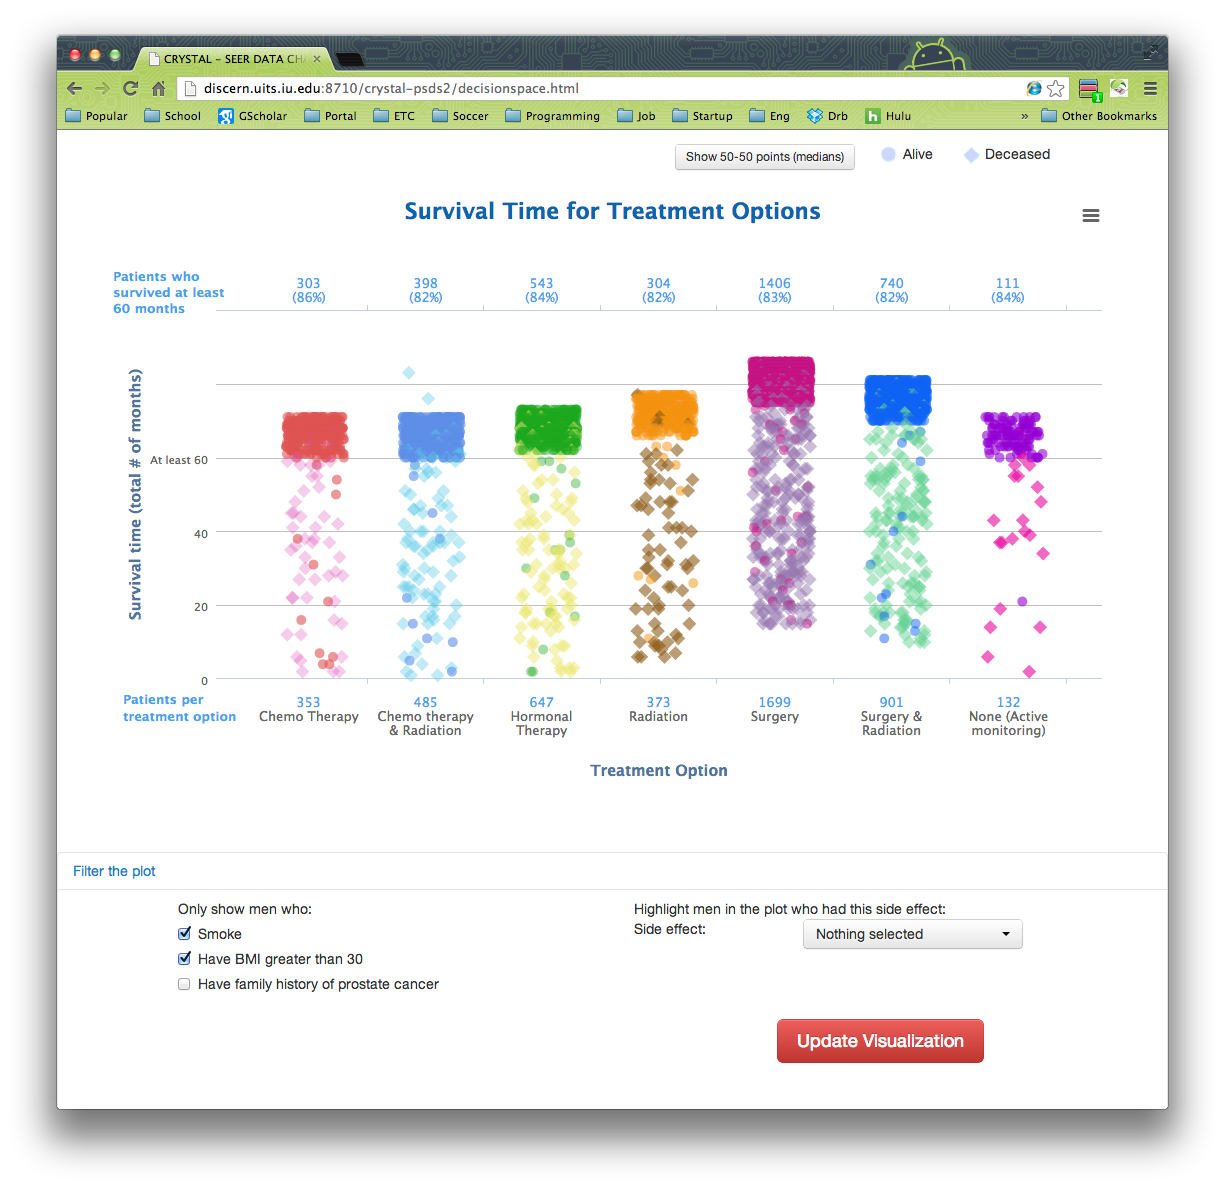
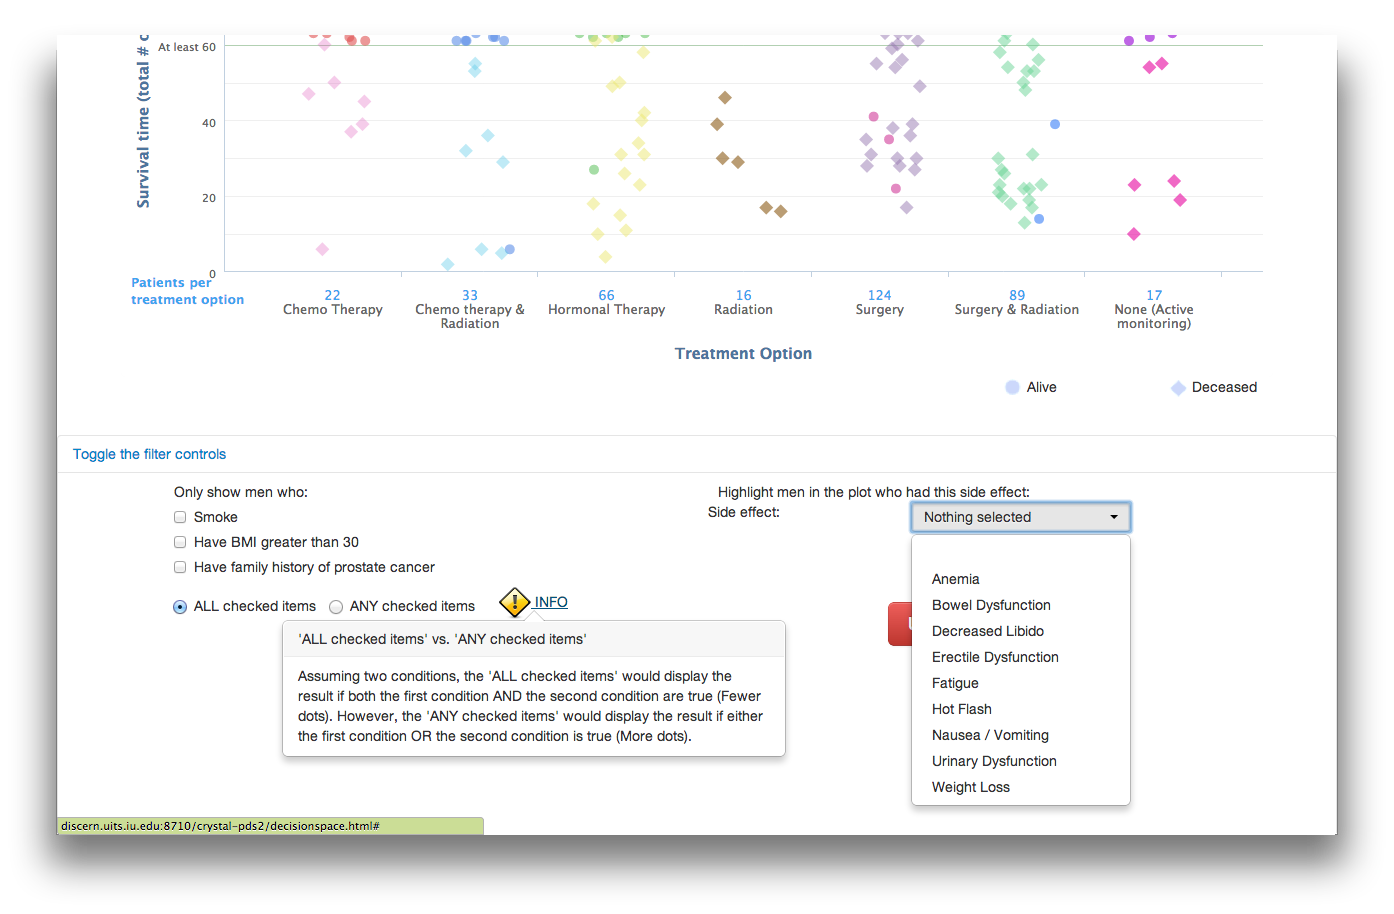
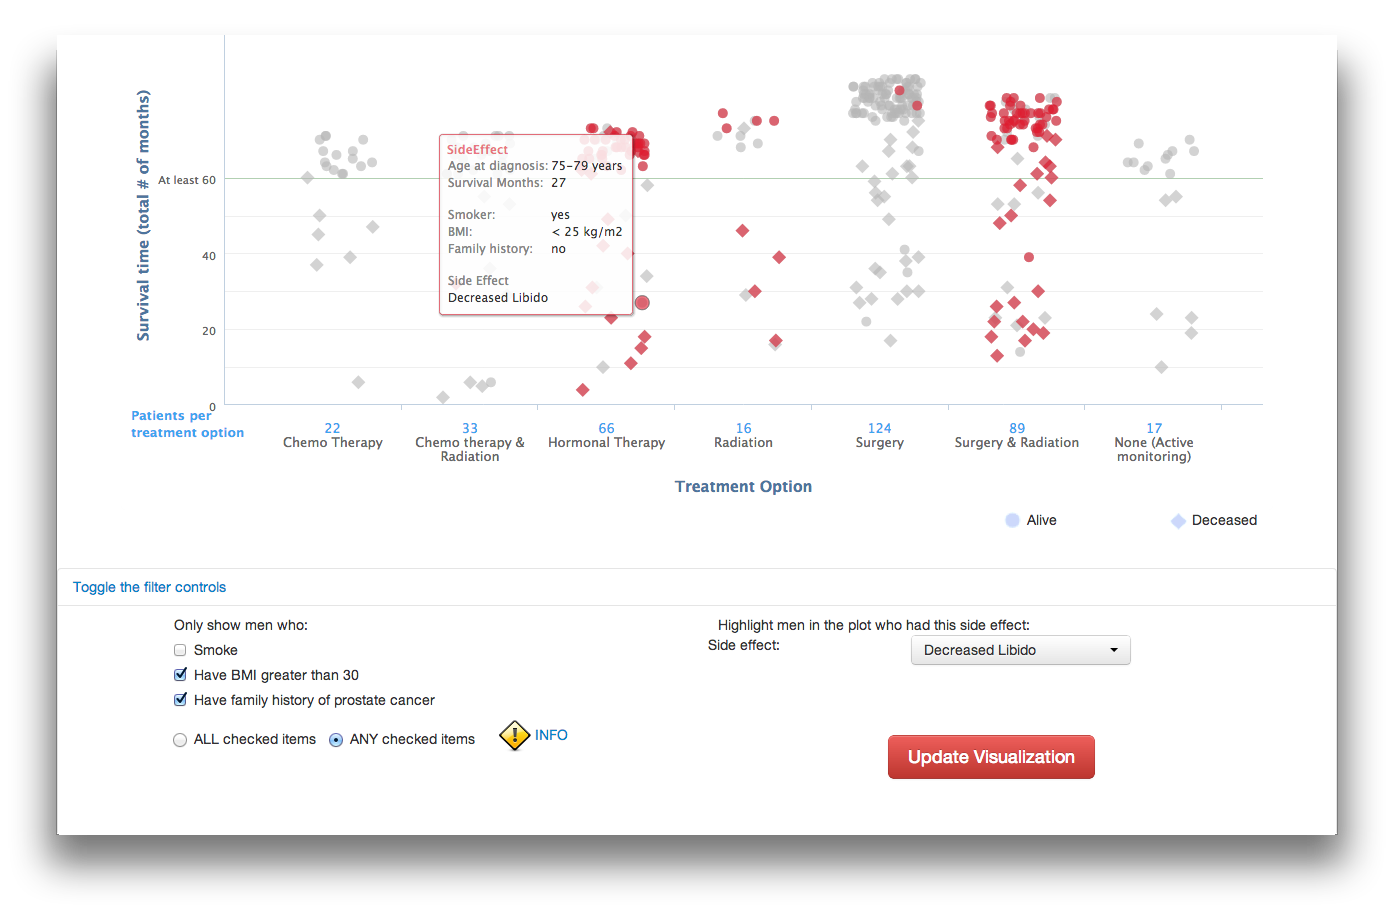
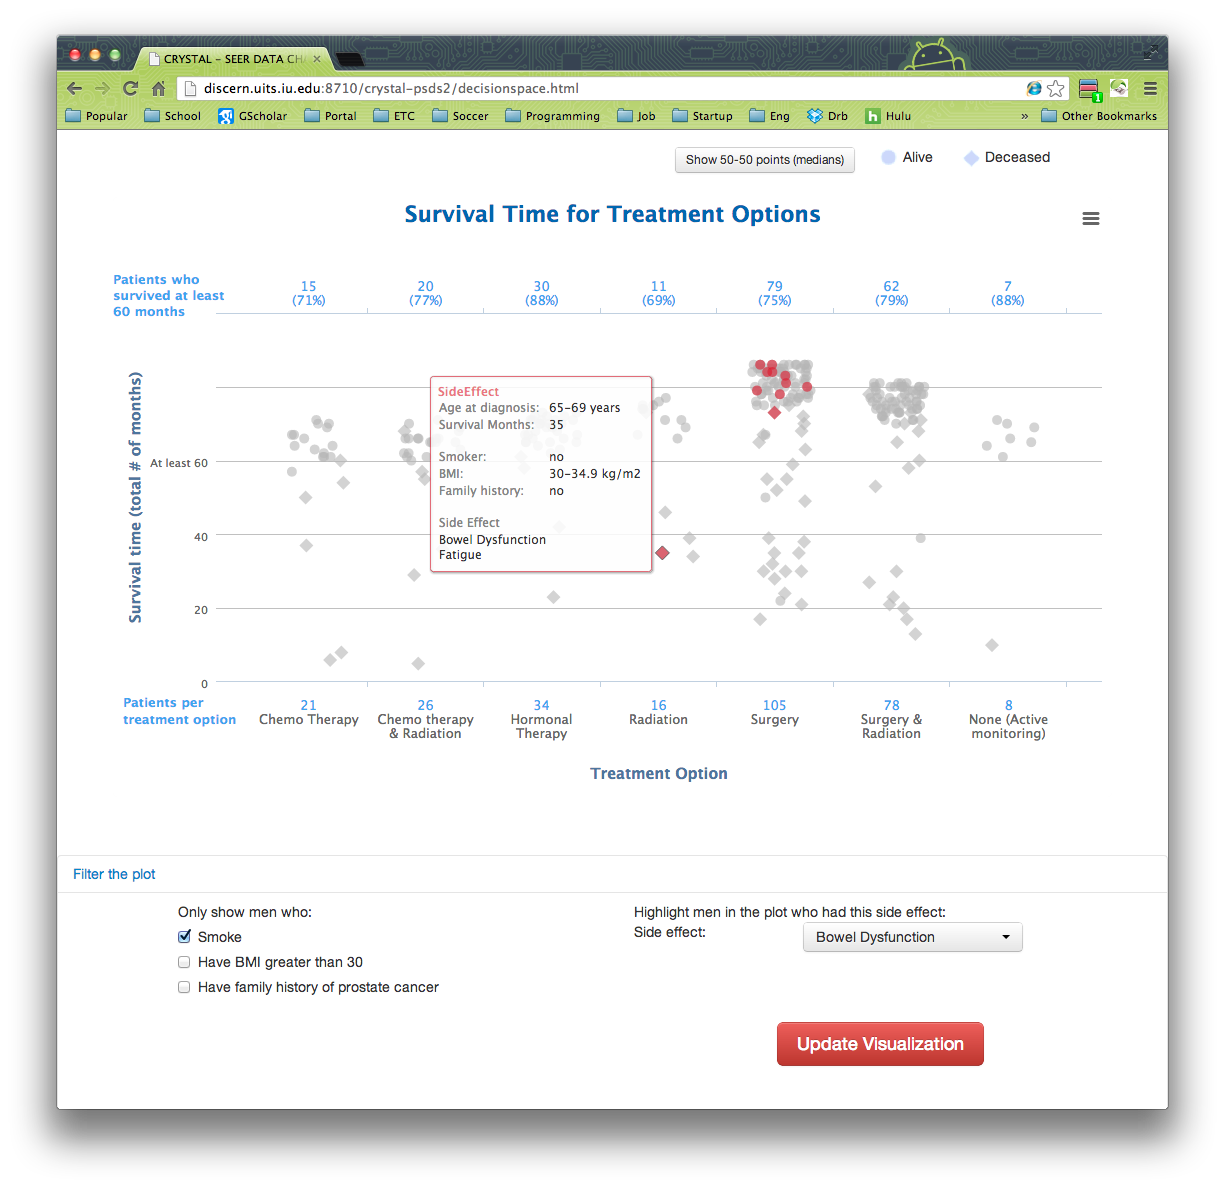
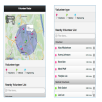
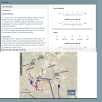
The Shared healthcare decision space infoVis tool is an intelligent information visualization tool that is designed for both patients and healthcare professionals to provide to create shared understanding of the patient data where they can understand which treatments people like them (similar others) chose and what their health outcomes were. It enables healthcare decision makers and patients to attain deeper levels of options awareness and choose a robust and optimal option via interactive visualizations of their treatments. The main visualization is a scatterplot where each dot represents a patient. Treatment options are listed along the x-axis and survival time along the y-axis. Along the top of the plot are numbers that represent the total number of patients who survived for five years for each treatment as well as the percentage. Therefore, users can interactively get better understanding of which treatment options resulted in longer survival months. Users can also interactively filter the data with a set of filtering options below the visualization to see how external variables (smoke, family history, and side effects) have influenced on their survival time. The data was mined from the National Cancer Institute (NCI) Surveillance, Epidemiology and End Results (SEER) database for patterns of patient attributes and treatments.
Main programming language & Library
HTML5, Javascript, CSS, Bootstrap, HighChart
My Part
UX/UI design, Data extraction / visualization, Front-end side implementation, Usability testing
Publication
Pfaff, M. S., Darling, E., Drury, J. L., & Klein, G. L. (2014). Patient Empowerment with Shared Decision Spaces. Procedia Technology, 16, 1477-1486. (link)
(This application was used as an appratus for the published paper)
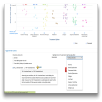
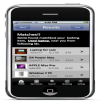
Top Health Trends


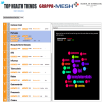
Description
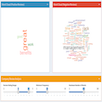
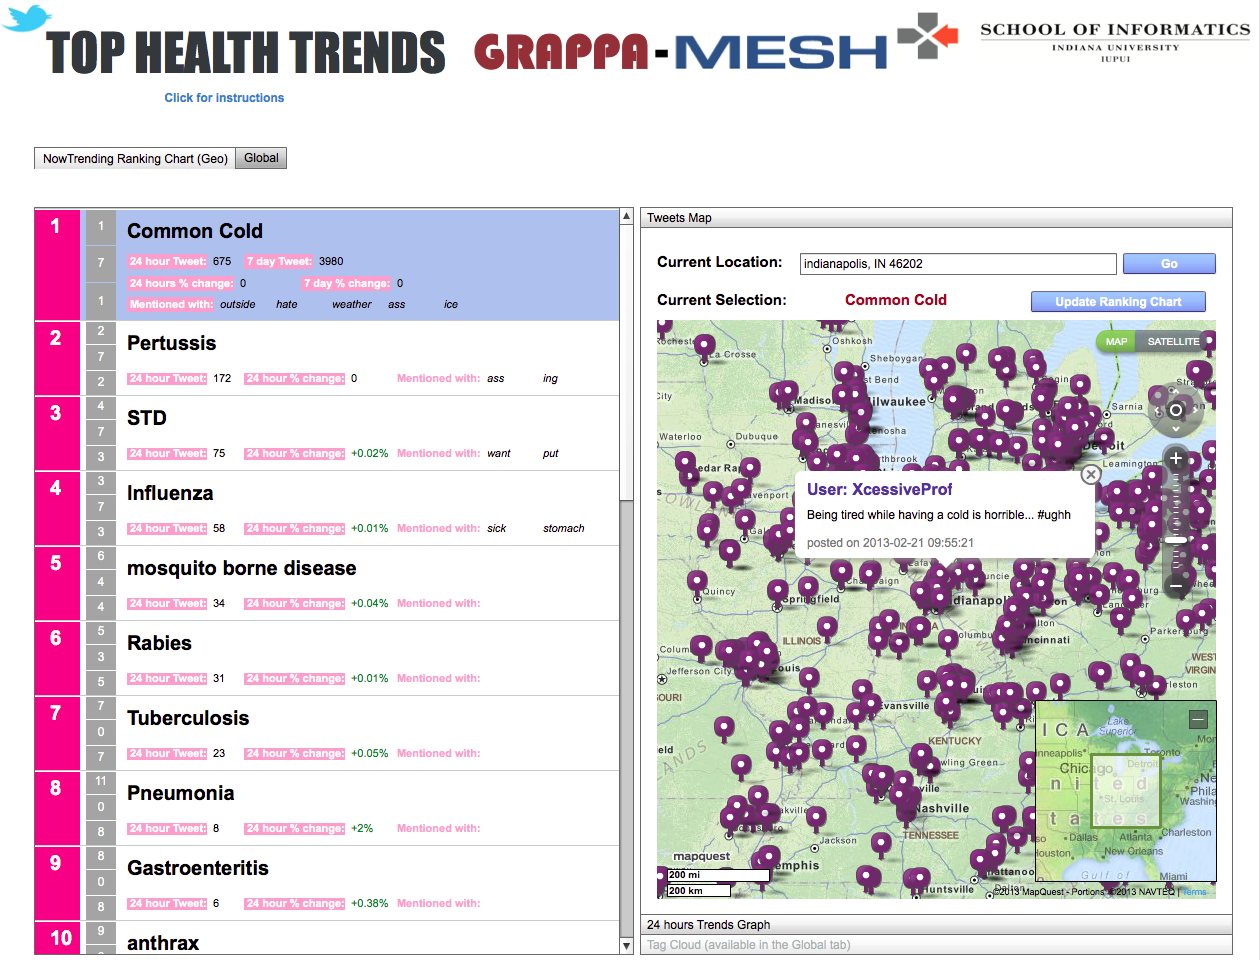
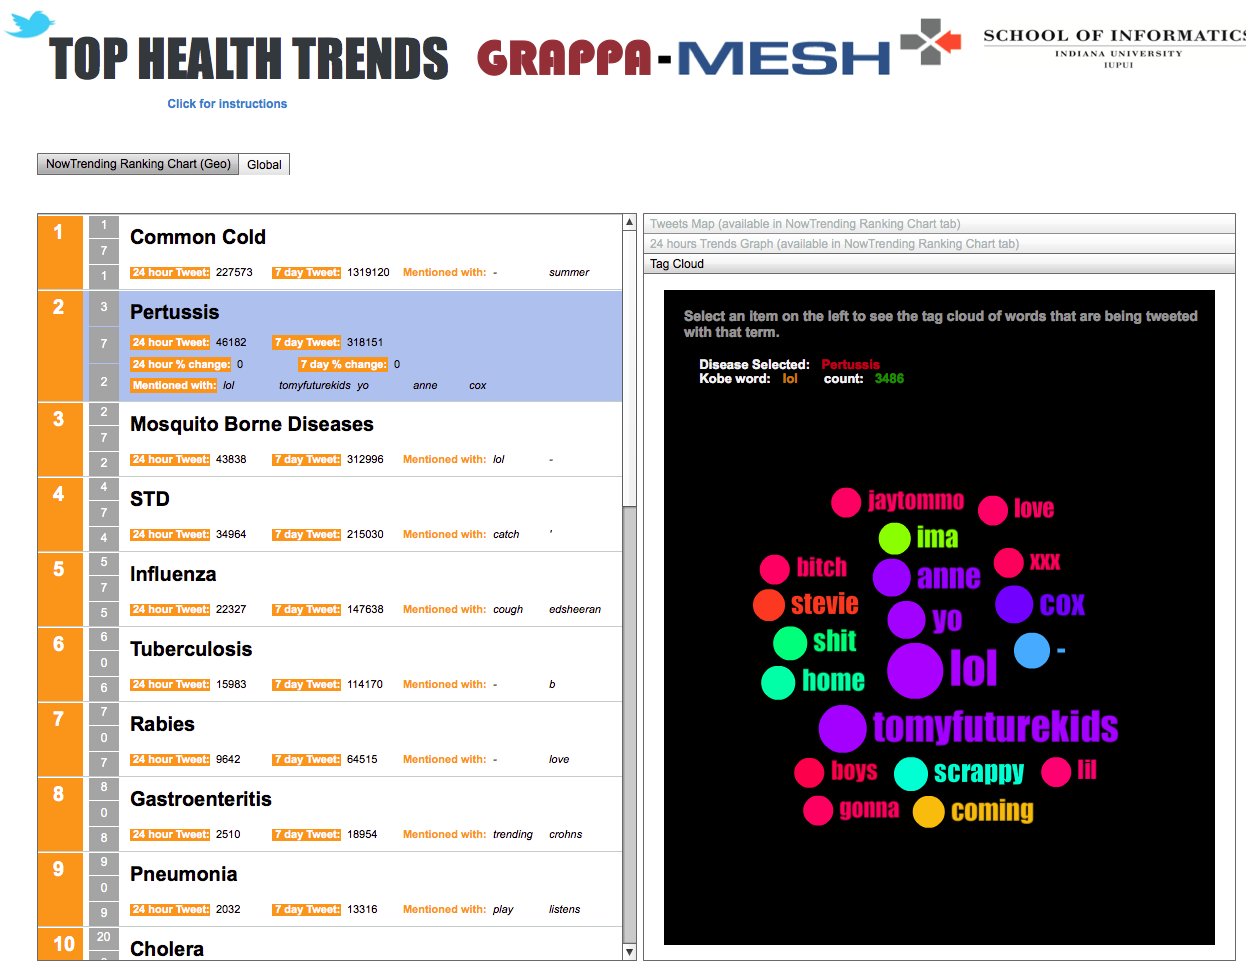
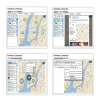
The TopHealthTrends is an intelligent information visualization tool that enables public health officials to be aware of health-related trends in any geographic area of interest, based on Twitter data. The goal of this tool is to support situation awareness (SA) for personnel responsible for early detection and response to public health threats. To achieve this goal, the application displays the most frequent health-related tweets in both a ranked chart and a map for a user-selected geographic area. We implemented automated processes that mine health-related tweets, filter them, visualize changes in terms of rankings over time, and present other keywords that are frequently associated with the tweets. Utilizing user-centered visualization techniques of monitoring, inspecting, exploring, comparing and forecasting, our tool supports each of the three stages of SA: perception, comprehension, and projection. An evaluation conducted with expert users in health-related domains provided significant insights about awareness of localized health trends and their practical use in their daily work.
Main programming language & Library
Adobe Flex SDK 4.6 / actionscript 3, Tomcat / Apache, MySQL.
My Part
Front-end side implementation, UX/UI design, Usability testing, User analysis, User Interviews, requirement gathering
Publication
Moon, S. P., Liu, Y., Entezari, S., Pirzadeh, A., Pappas, A., & Pfaff, S. M. (accepted, to be published in May, 2013). Top Health Trends: An information visualization tool for awareness of local health trends. 10th International Conference on Information Systems for Crisis Response and Management (ISCRAM'13). Baden-Baden, Germany, May 12-15.
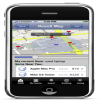
MARVAND: Mobile Application for Relief Volunteering Activity after Natural Disasters
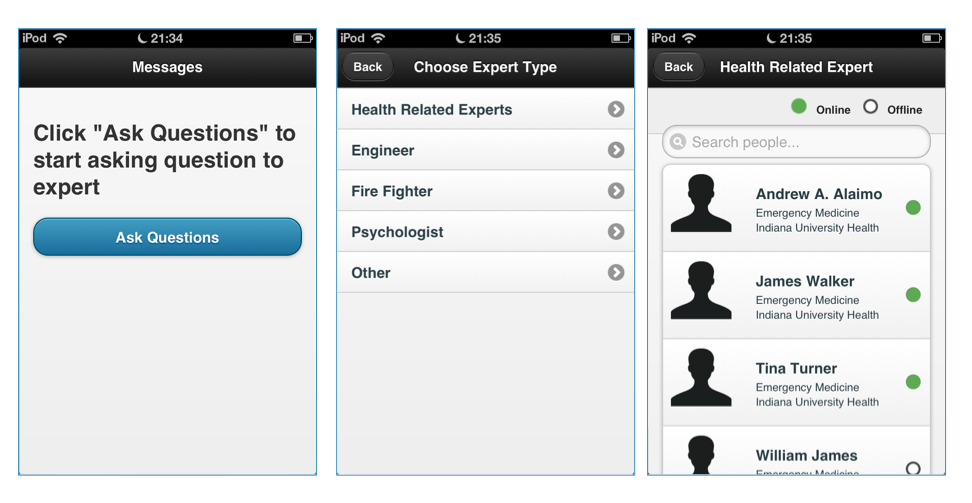
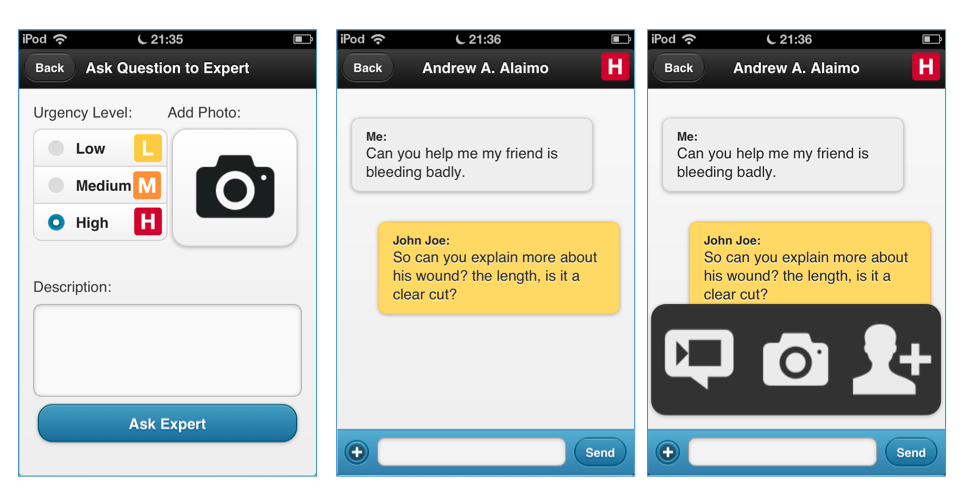


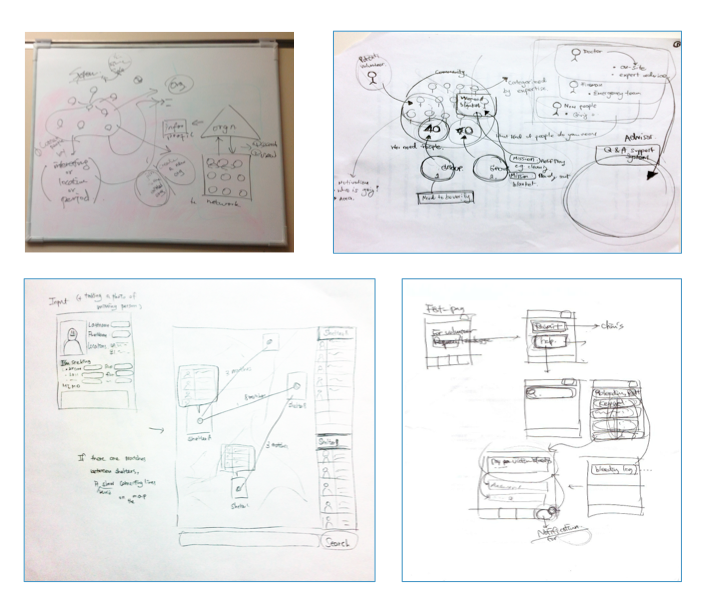
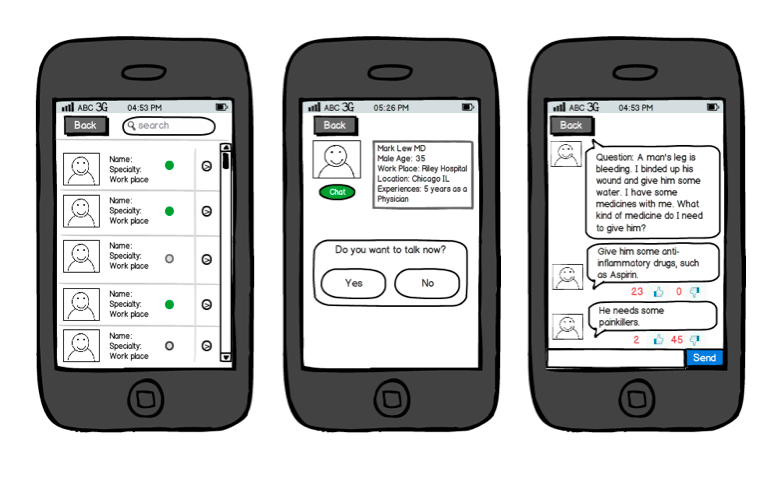
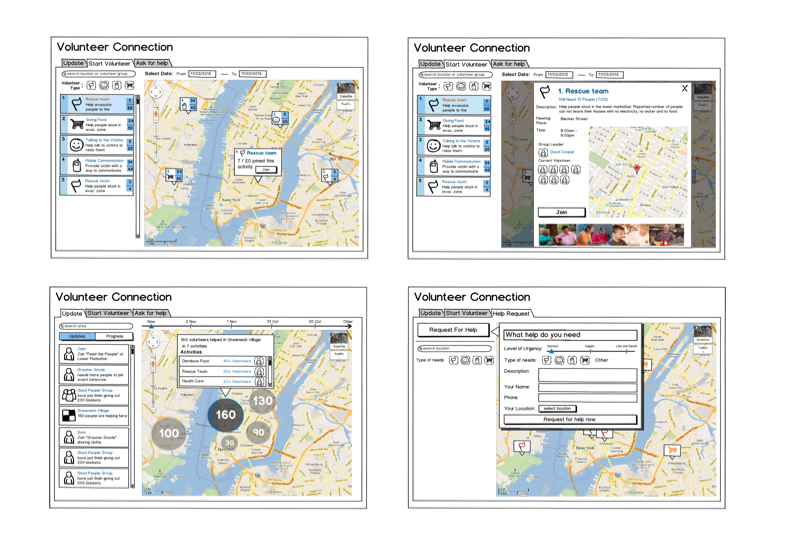
Description
Modern technologies play significant roles in the natural disaster domain. Current services focus mostly on providing information, recruiting volunteers, donating money and goods while less on supporting activities of onsite volunteers. Our preliminary interviews showed that there are not enough experts to help support on-site volunteers and it is difficult to keep track all help request have been met. To fill this gap, we developed a MARVAND, utilizing LBS, with three main features: 'Instant Crowd Knowledge' providing access to remote experts using crowdsourcing concept; 'Volunteer Radar' providing awareness of other volunteers nearby; 'Reunite Missing Family Members' helping reunite family members who they have lost contact with. The results of the evaluations with twelve participants who had experience in disaster relief volunteering activities demonstrated that the MARVAND could support activities of onsite volunteers after the natural disaster, and serve as an additional communication channel between volunteers and experts.
Main programming language & Library
jQuery mobile, javascript, HTML5, CSS, Kinvey BaaS.
My Part
Front-end side implementation, UX/UI design, Usability testing, User analysis, User Interviews, requirement gathering
Publication
Moon, S. P., Liu, T., Powit, R., Kim, B.M., & Pfaff, S. M. (submitted on February 15, 2013). MARVAND: Mobile application for relief volunteering activity after natural disaster. 15th International Conference on Human-Computer Interaction with Mobile Devices and Services, MobileHCI, 2013. Munich, Germany
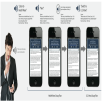
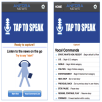
ANFORA (Aural Navigation Flow On Rich Architecture) Linkless
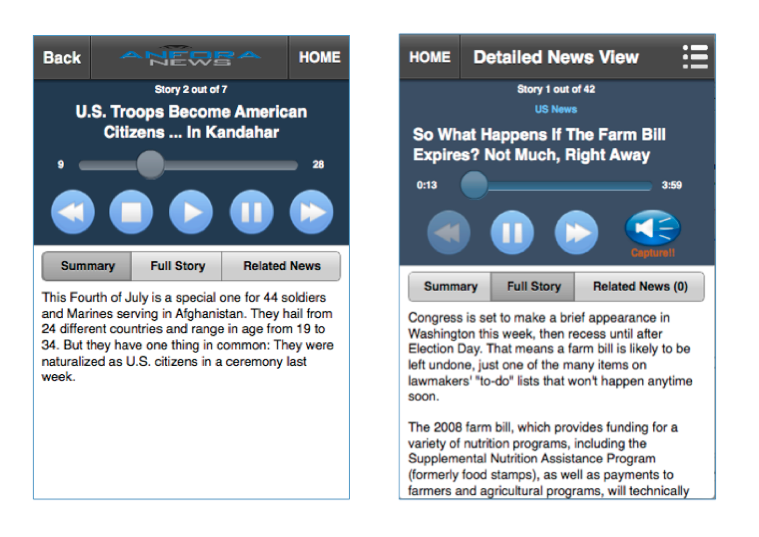

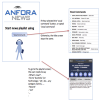
Description
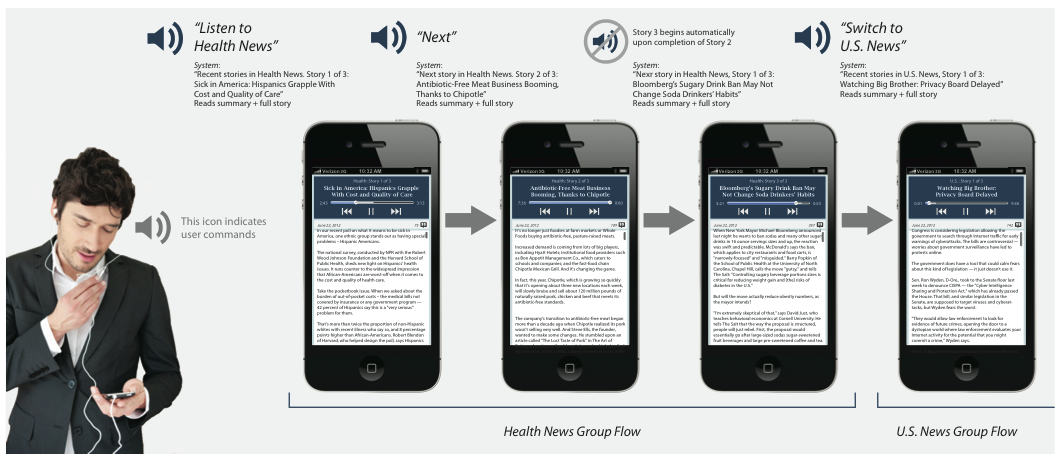
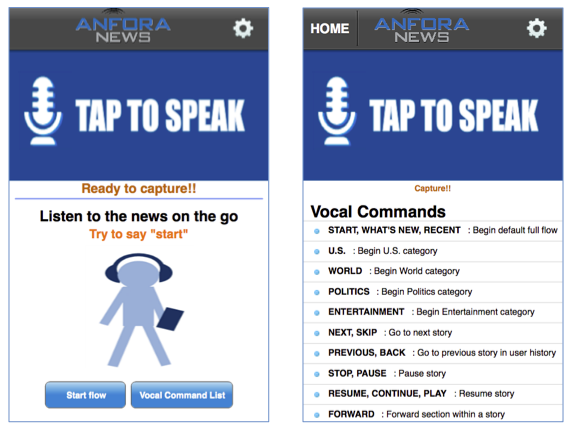
ANFORA is a design framework for providing text-to-speech consumption of non-linear, web architectures with little user interaction. ANFORA is designed to make web / mobile contents easy to access when users are on-the-go and it is undesirable or unsafe to visually browse hierarchical, content-rich websites. With ANFORA linkless strategy, users are able to navigate through stories and related contents by using simple vocal commands and tactile controls. This strategy allows users who are engaged in other primary tasks, such as walking or driving, to interact with the mobile device with limited visual interaction.
This is a NSF-funded project.
Patent Pending: No.61/699, 748 - Aural Navigation of Information-Rich Visual Interfaces
Main programming language & Library
Adobe Flex Mobile / actionscript 3.
My Part
Mobile high-fidelity prototype / android application implementations, usability testing (pilot testing).
PREVIOUS PROJECTS
Grappa Decision Space InfoVis Tool

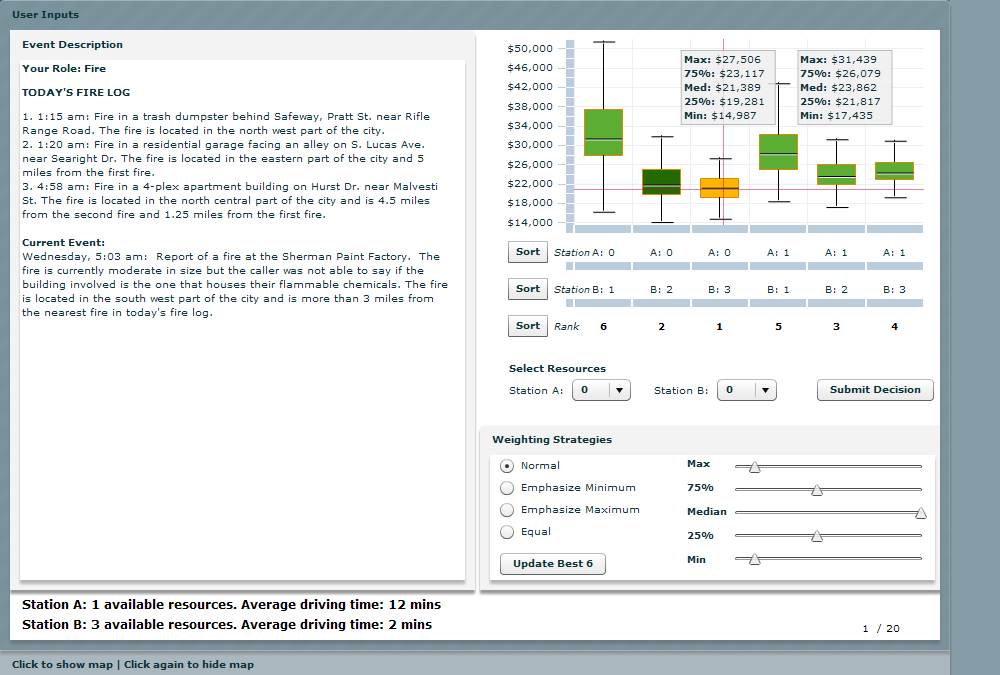


Description
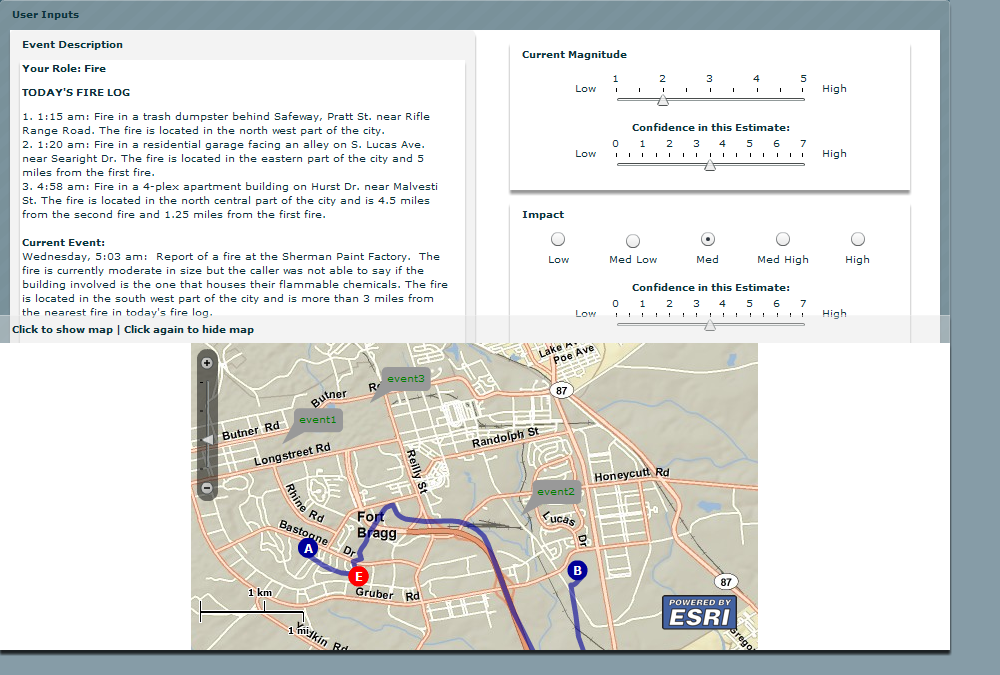
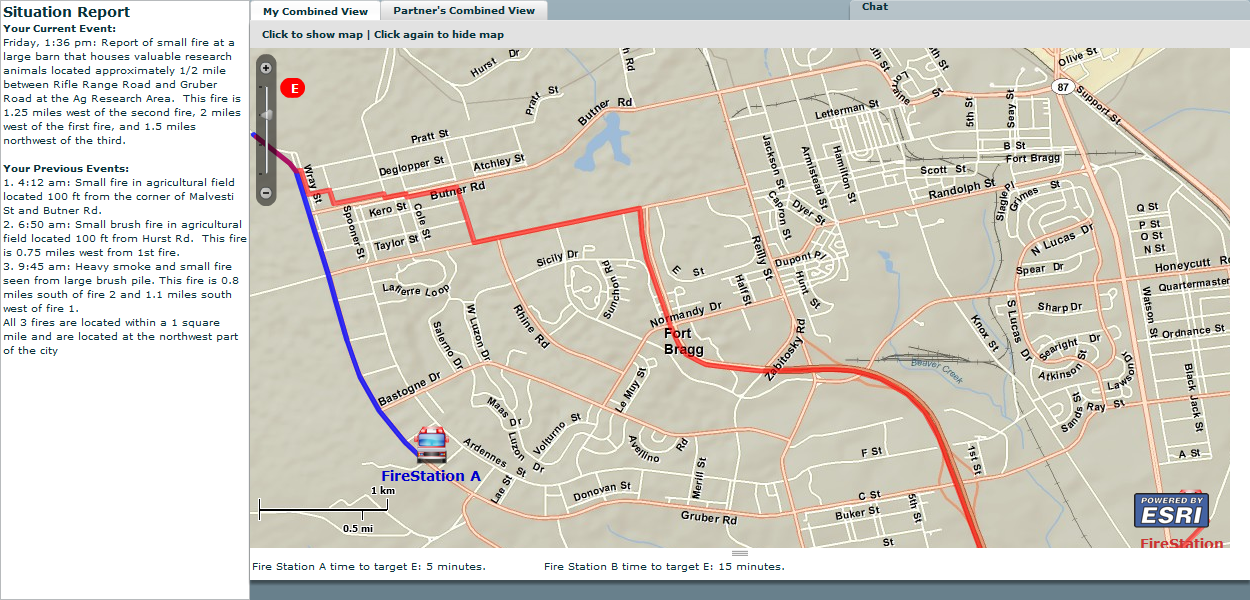
The Grappa Decision Space information visualization tool is a model-based decision- making simulator which provides decision makers a set of visualizations summarizing the range of future consequences for executing each option they selected. The tool was designed to aid them to make the best- optimized decision by reducing cognitive burdens such as mental calculation about the future damages of their decision. (4th version developed in 2011)
This is a project funded by the MITRE research corporation
project #: 43MSR001-EA, 45MSR026-FA.
Main programming language & Library
Adobe Flex SDK 3 / actionscript 3, MySQL, Tomcat/Apache, ESRI Map SDK. (My part: visualizations, chart controls, & map controls).
My Part
Front-end side implementation, Usability testing, User analysis, Requirement gathering
Publication
Pfaff, M. S., Klein, G. L., Drury, J. L., Moon, S. P., Liu, Y., & Entezari, S. O. (2012). Supporting complex decision making through option awareness. Journal of Cognitive Engineering and Decision Making, Advance online publication. doi: 10.1177/1555343412455799
Liu, Y., Moon, S. P., Pfaff, M. S., Drury, J. L., & Klein, G. L. (2011). Collaborative option awareness for emergency response decision making. the 8th Annual International Conference on Information Systems for Crisis Response and Management (ISCRAM), Lisbon, Portugal, May 2011.
Pfaff, M. S., Drury, J. L., Klein, G. L., More, L. D., Moon, S. P., & Liu, Y. (2010). Weighing decisions: Aiding emergency response decision making via option awareness. Proceedings of the 2010 IEEE International Conference on Technologies for Homeland Security (HST), 251-257.
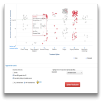
IU Grading Distribution Prototype
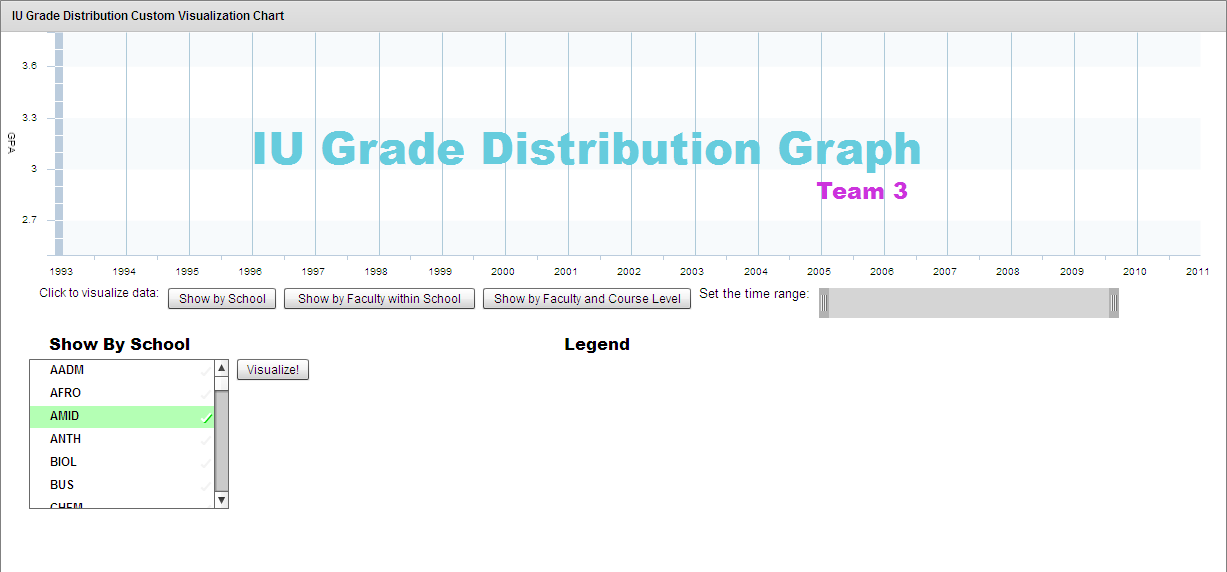
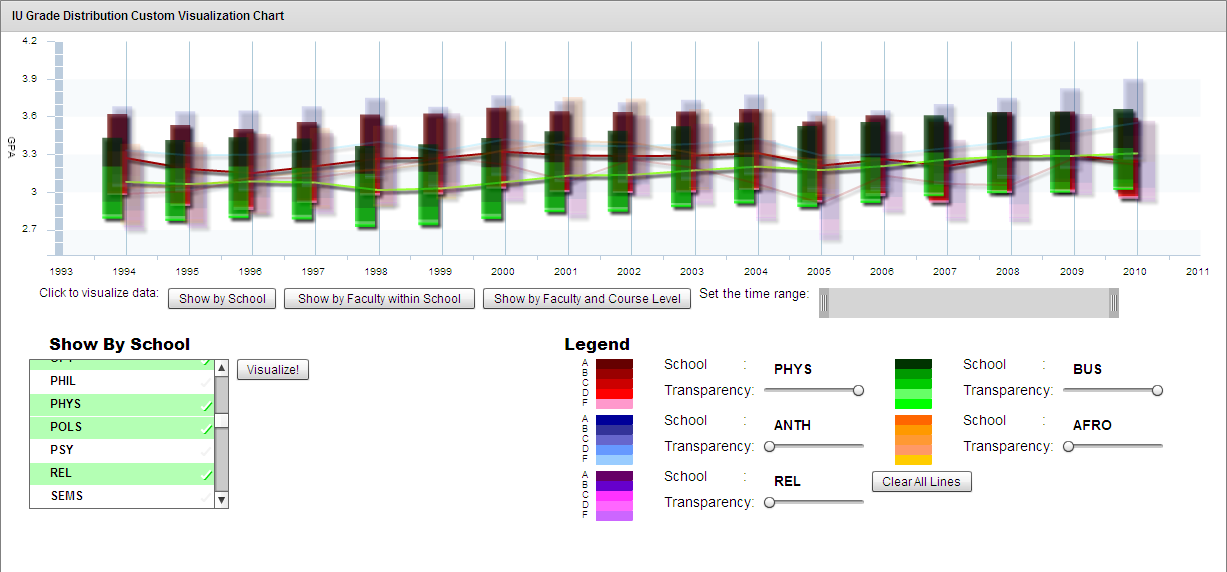
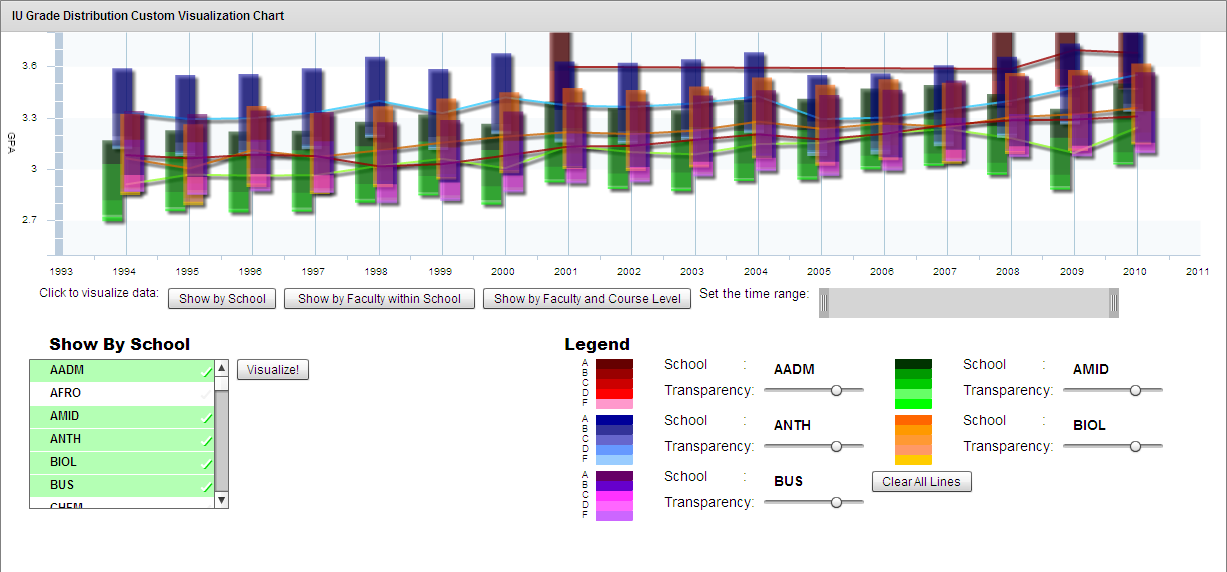
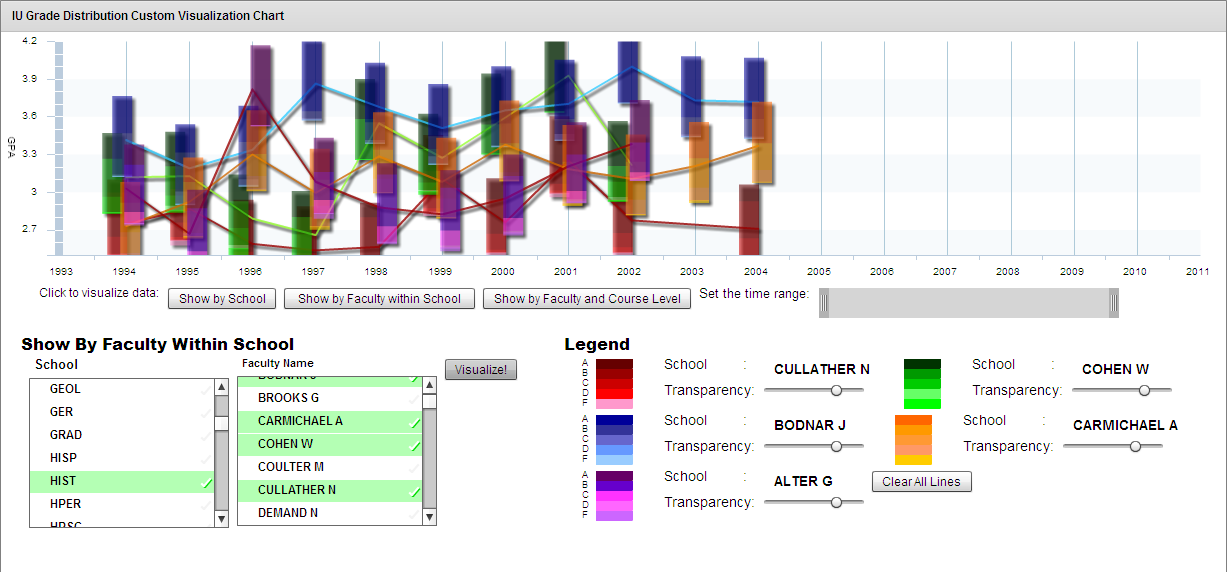
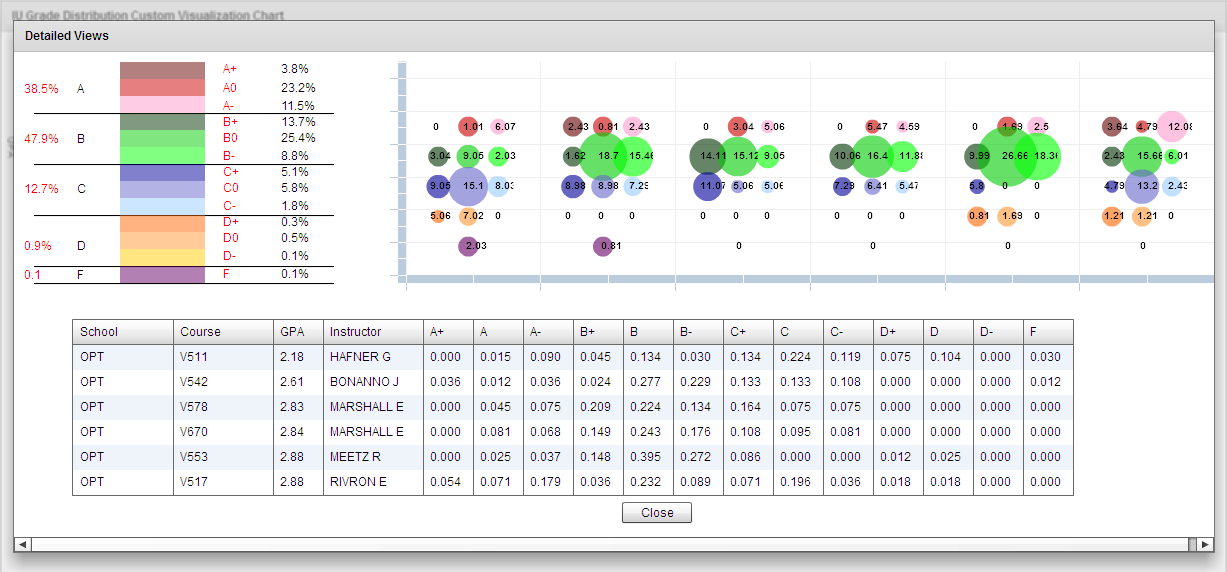
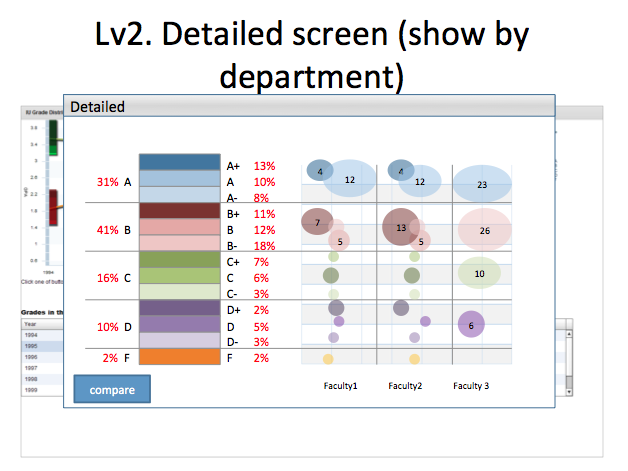
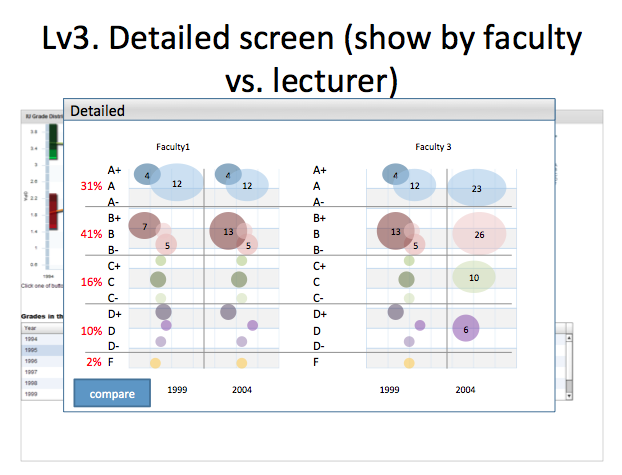


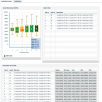
Description
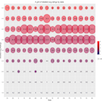
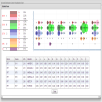
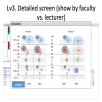
This prototype is a part of the information visualization class. This information visualization prototype is to show grading trends in Indiana University from 1994 to 2010. The overall purposes were to identify overall trends of grading behaviors, to identify which department shows relatively a significant / steady change in specific grade (A, B, C, D or F), and to identify which department gives higher / lower scores in average. After iterative user testing, my colleague, Arthur Liu, and I created a custom chart combining merits of both line chart & area chart so that it could help users easily compare and see the changes over time. Trends can be selected by school, by faculty within / across school, and by course level. 6 items can be simultaneously selected due to human identification constraint on a number of color gradations. (developed in April, 2011).
Main programming language & Library
Adobe Flex SDK 3 / Actionscript 3, MySQL, Tomcat/Apache.
My Part
Front-end side implementation, UX/UI design, Custom chart visualization, Usability testing, User analysis, User Interviews, requirement gathering
User Feedback with Mobile Protytypes of Varying Fidelity

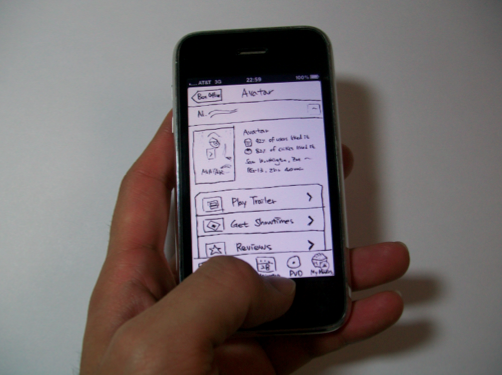
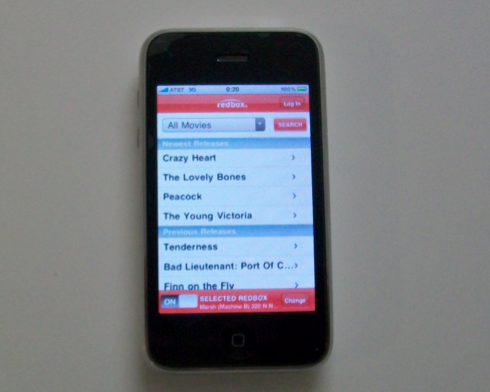

Description
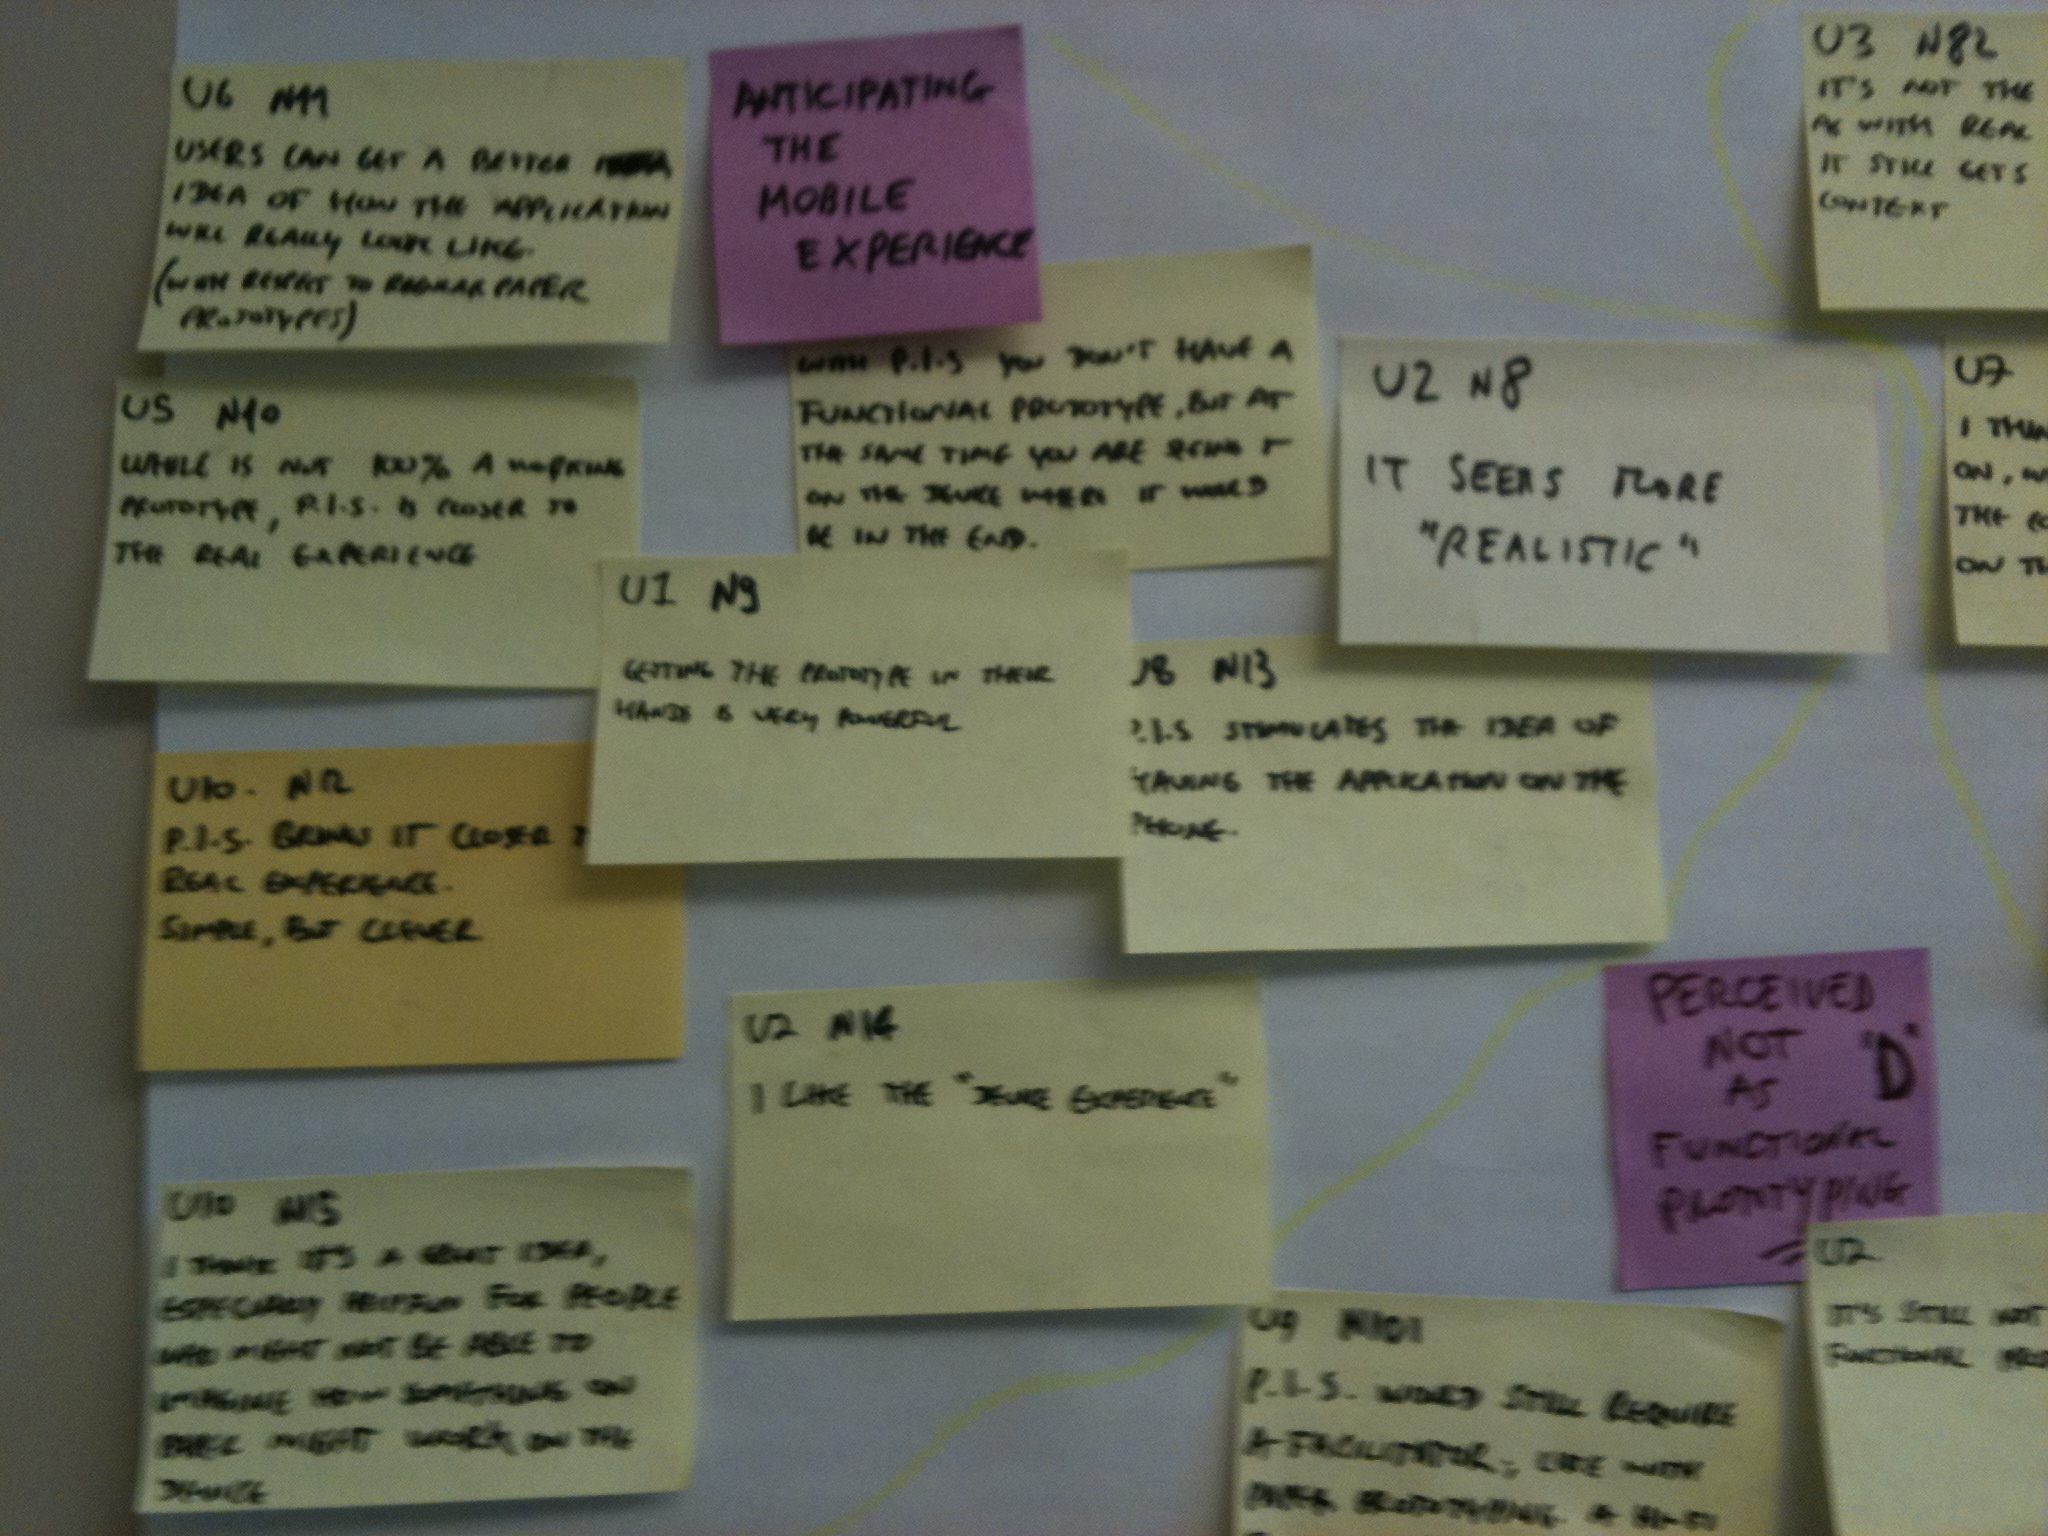
This project investigated the characteristics of the users' feedback associated with three types of mobile application prototypes: low- fidelity (paper only), mixed-fidelity (paper screens scanned and made interactive in a real device), and high-fidelity (in a fully functional application). The basic purpose was to identify how different levels of prototype fidelity would produce different types of feedback from users. The results showed mixed-fidelity prototype produced more comments related to the application's design components than the high-fidelity prototype, and high- and mixed-fidelity prototype conveyed the application concept equally well than the low-fidelity prototypes.
My Part
Front-end side implementation, UX/UI design, Usability testing, User analysis, User Interviews, requirement gathering
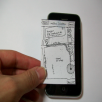
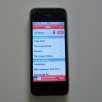
Highschool Basketball On Prototype
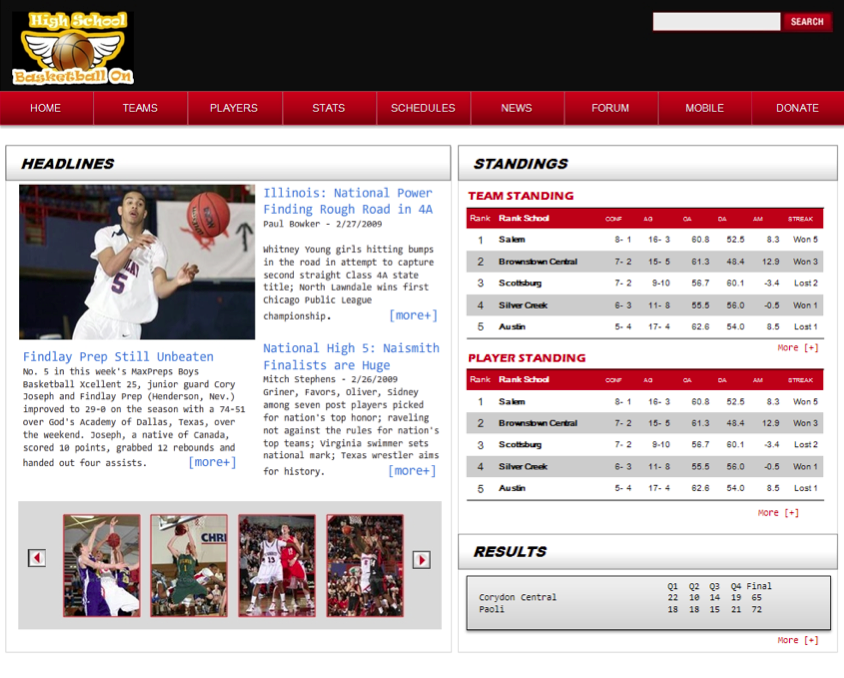
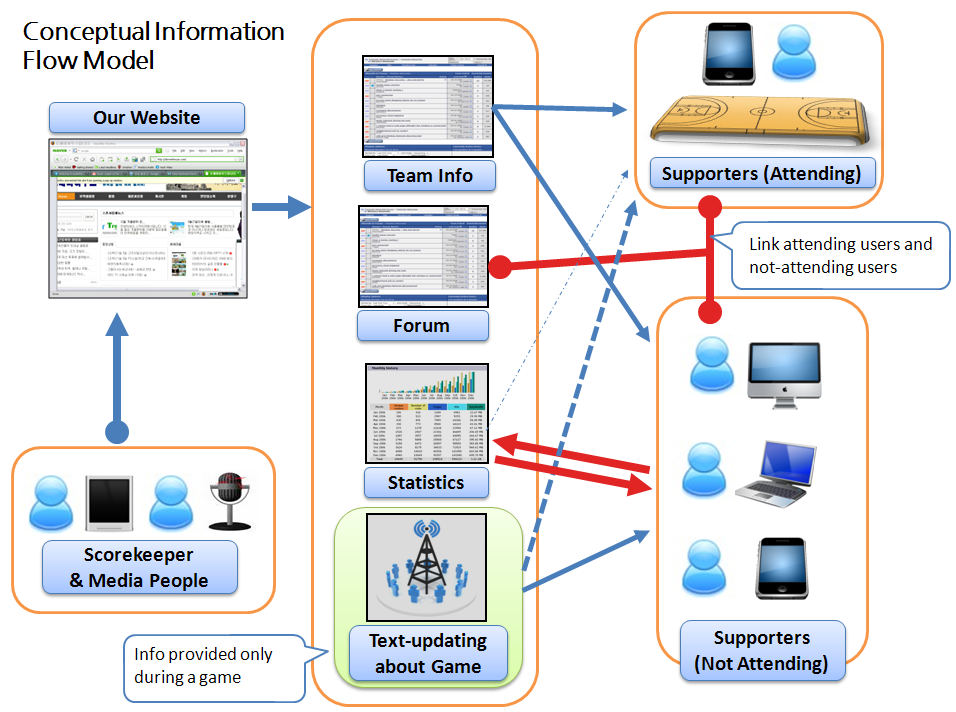
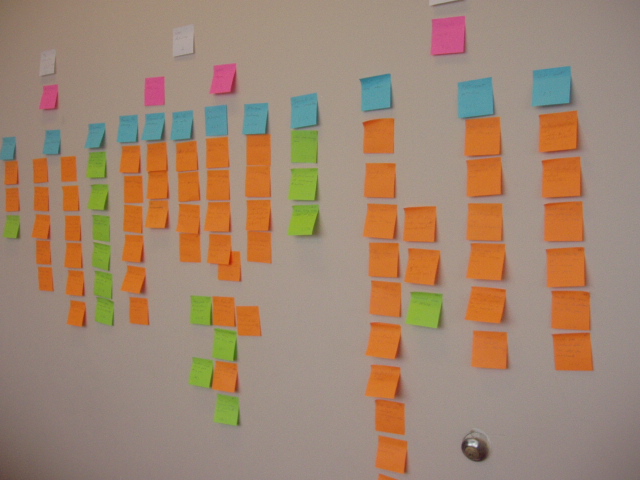
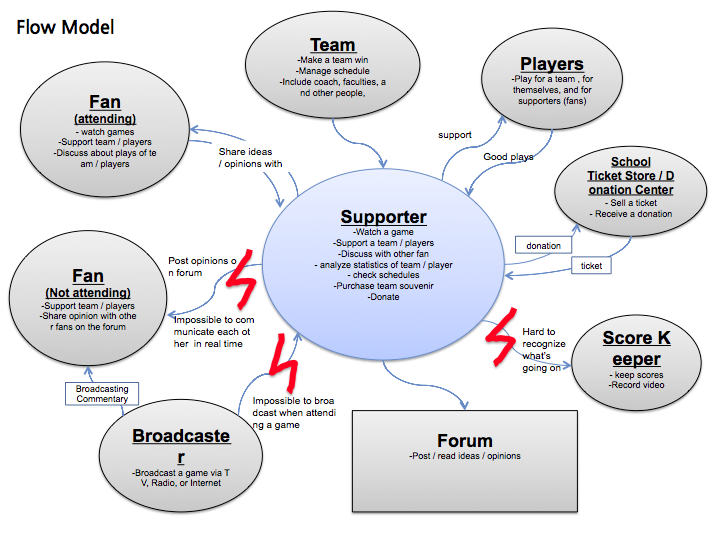
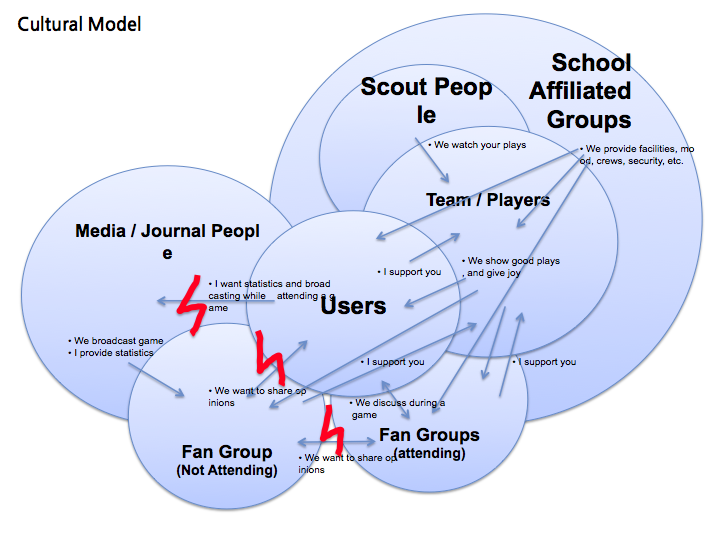
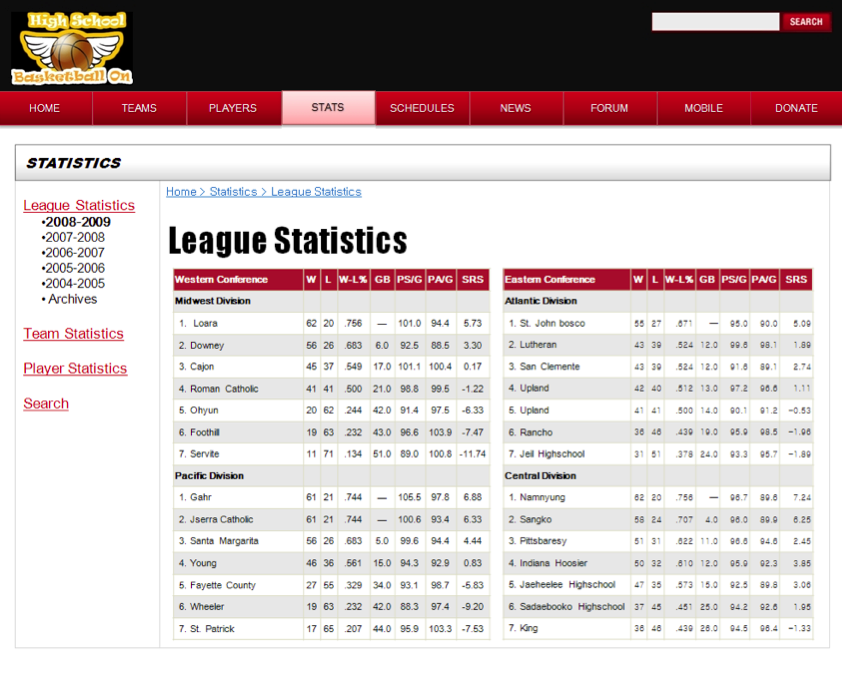

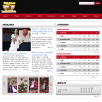

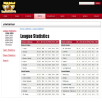
Description
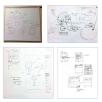
This is a part of the HCI-2 Class Project. The goal of this project was to design an innovative interactive application supporting the activities of the users in one of the proposed application domain. Then, we chose the sports domain, and developed a prototype to provide sports fans various ways to access statistics info about highschool basketball. The prototype was started from identifying stakeholders, getting user requirements, collecting / analyzing field data, drawing a flow diagram, a conceptual diagram, a cultural diagram, an affinity diagrams, and sketches of the prototype (low-fidelity prototype). Then the high fidelity prototype was developed with Adobe Flash.
Main programming language & Library
Adobe Flash.
My Part
User analysis, User Interviews, requirement gathering, Prototyping, Usability testing.
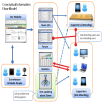
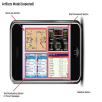
Re-designing a Home Communication Cetner
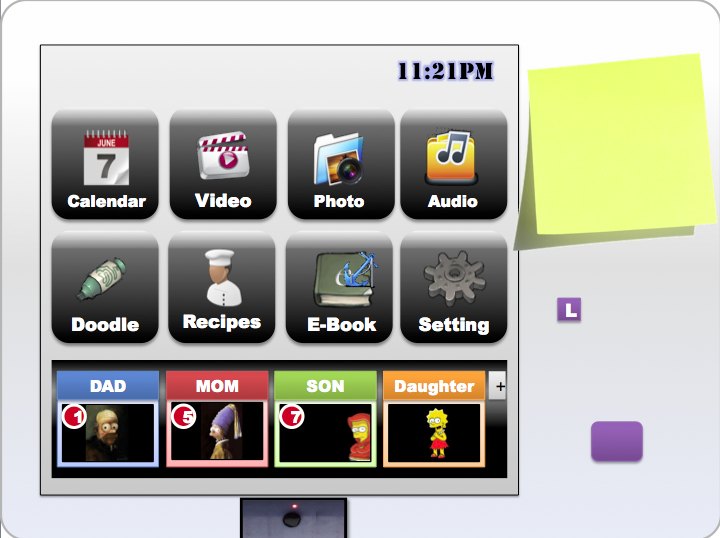
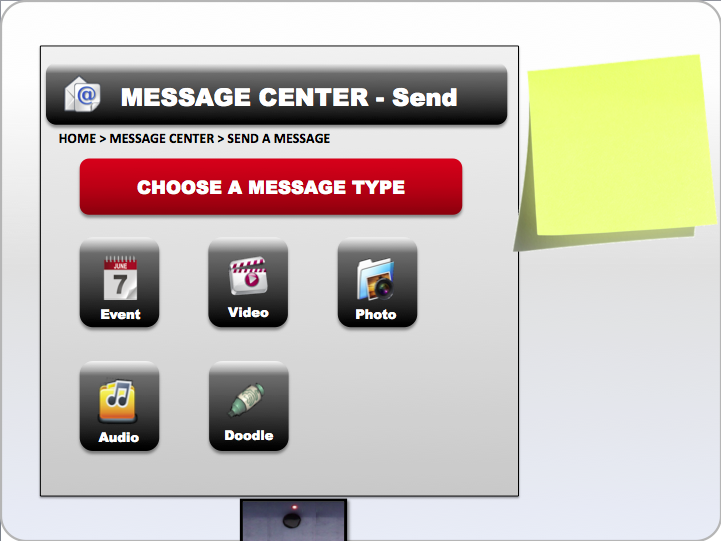
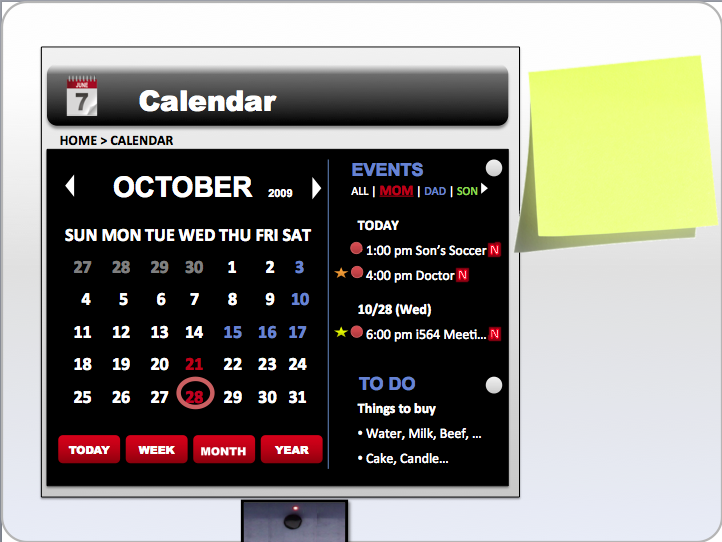
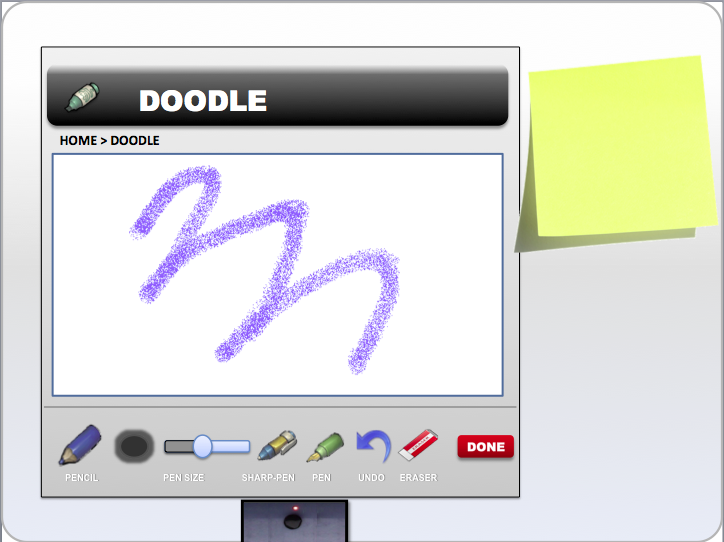
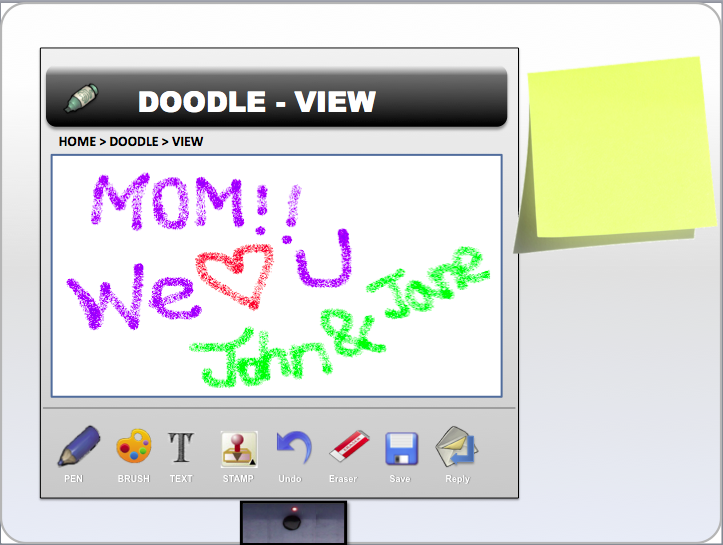
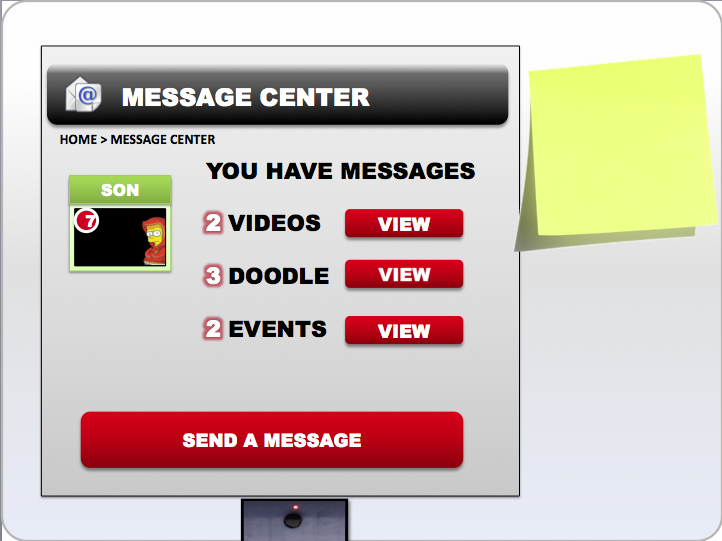
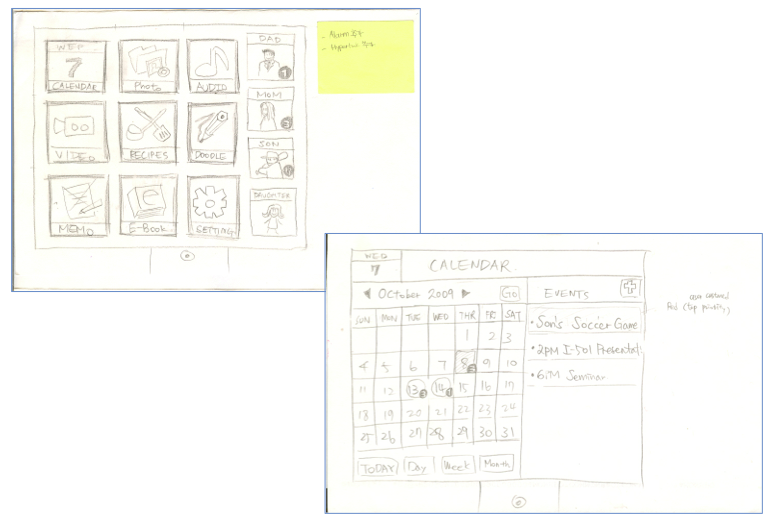
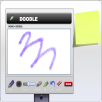

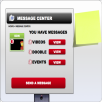
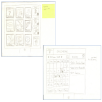
Description
This prototype is a part of the Prototyping class. The overall goal of this project was to build an interactive message system which has ease of usability and which is portable to be used around anywhere at home. The assumptions of the home message center were that it should be used by different age groups, mounted on the refrigerator, heavily used as another way of communicating with family members at home at different times, and used to view various multimedia files and to notify calendar events. This project was done with getting requirement sets / user profiles, identifying design concepts, drawing flow / conceptual diagrams, developing low-fidelity / high-fidelity prototypes iteratively, and conducting cognitive walkthrough. The high-fidelity prototype was mainly built with the MS PowerPoint.
Main programming language & Library
MS Powerpoint.
My Part
Usability, Prototyping, UI/UX design, User analysis, requirement gathering, Cognitive walkthrough
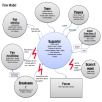
Designing an innovative shopping service
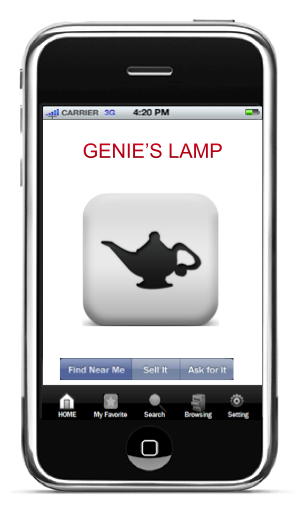
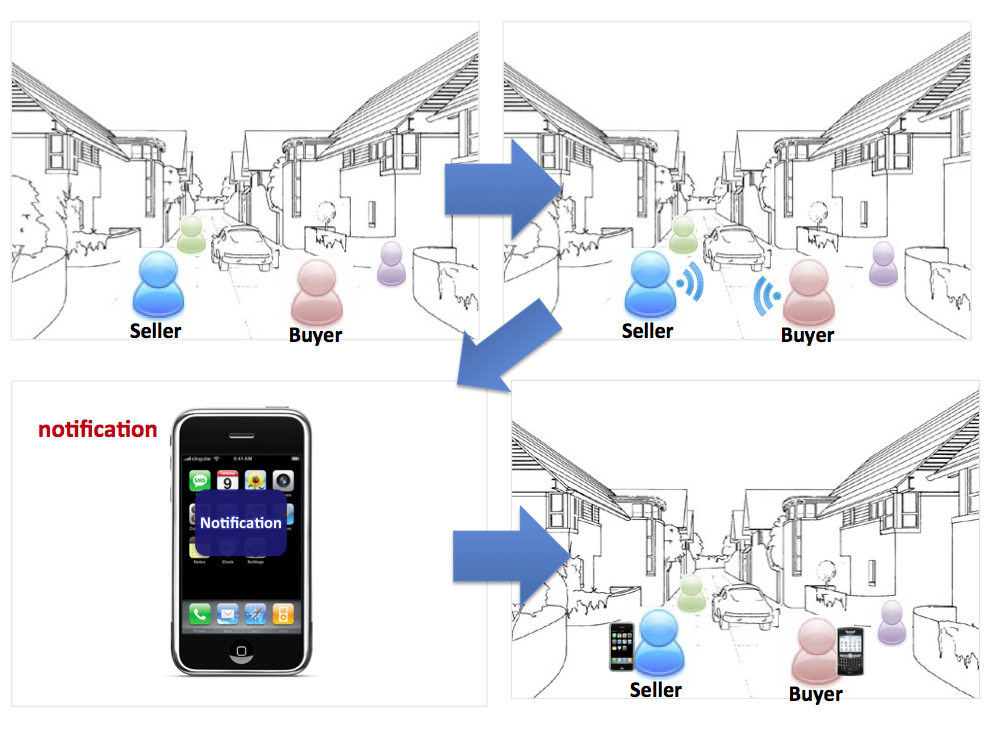
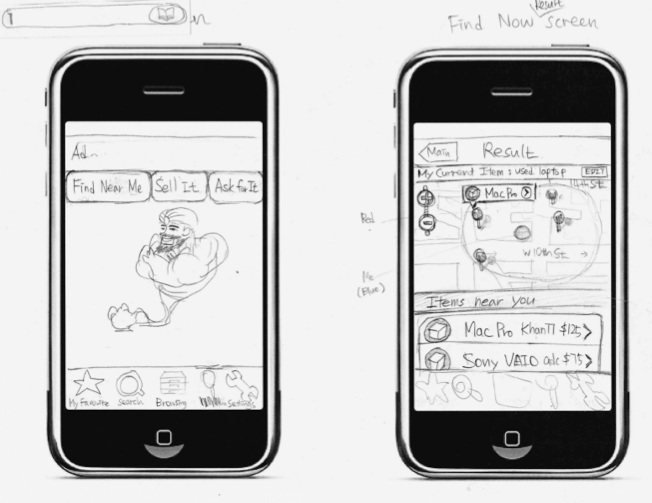

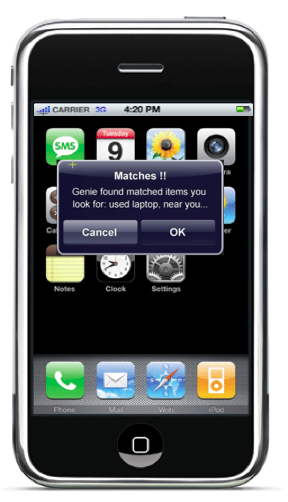
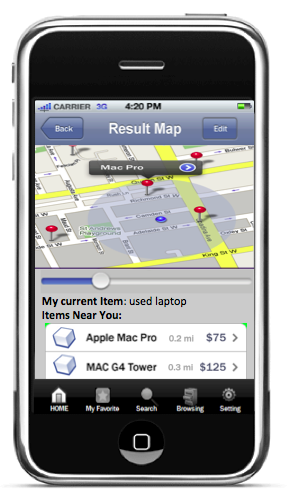
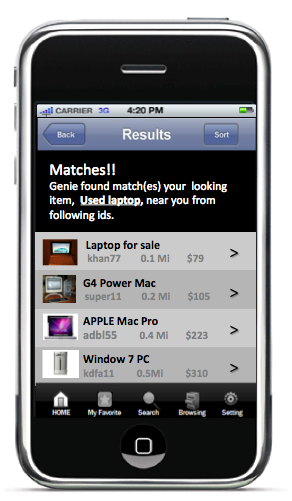
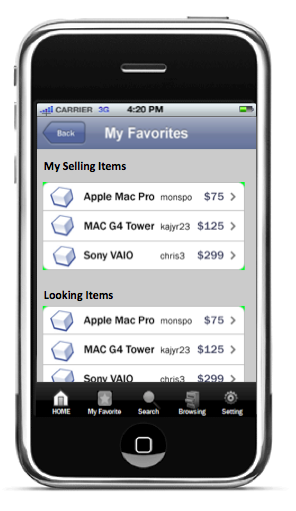


Description
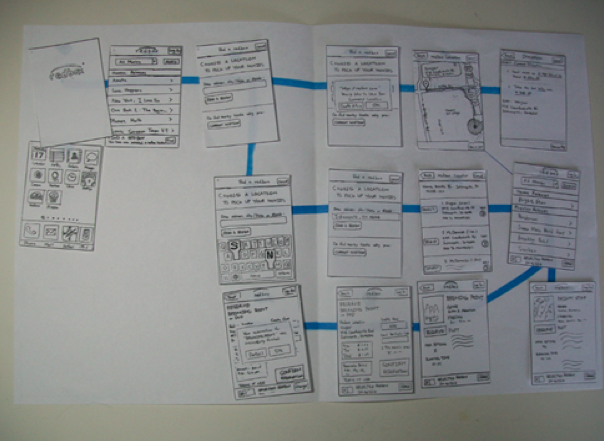
This project is a part of the prototyping class. This prototype was designed as an innovative and integrated method using social media and instant notification service in a mobile device. The idea was to bridge sellers and buyers through combinations of a social network sites, a classified shopping website, and a location-based service so that they both actively search for the desired items. This project was also done with getting requirement sets, drawing flow / conceptual diagrams, developing low-fidelity / high-fidelity prototypes iteratively, and conducting cognitive walkthrough. The high- fidelity prototype was built with the Axure Prototyping tool, and the MS PowerPoint.
Main programming language & Library
MS Powerpoint, Axure Prototyping tool.
My Part
User analysis, Requirement gathering, Cognitive Walkthrough, Prototyping, Usability Testing.